
Climate opportunities for Gelderland, from energy to agriculture
This climate opportunities map sets out, per sector, the biggest climate opportunities for Gelderland: where emissions fall and where carbon is sequestered. Five sectors, one measuring stick. The map follows on from the Climate Action Recap (PCSA) for Gelderland and is part of the Climate Action Recap service.
Opportunities by sector, side by side
Energy, built environment, agriculture and land use, mobility and industry. For each sector, the map calculates the potential for reduction and sequestration, so a province, municipality, investor or business can see where action pays off most.
A regional climate plan with opportunities per sector
A climate opportunities map connects emission reduction with carbon sequestration and translates climate ambition into concrete, quantified opportunities per sector. New Economy develops these maps for provinces, municipalities and regions, based on the Drawdown methodology, the GHG Protocol and science based targets. This map for Gelderland builds on the earlier Climate Action Recap (PCSA).
About this climate opportunities map
- Prepared for
- Province of Gelderland.
- The question
- Map, per sector, where the biggest climate opportunities lie for reduction and sequestration, so the province can prioritise action.
- Method
- The Drawdown methodology, combined with an analysis of Gelderland’s greenhouse gas emissions by sector.
- Relation to the PCSA
- Follow-up to the Climate Action Recap (PCSA) for Gelderland. That analysis looked at non-energy emissions; this map broadens the scope to five sectors, including energy.
- Most notable result
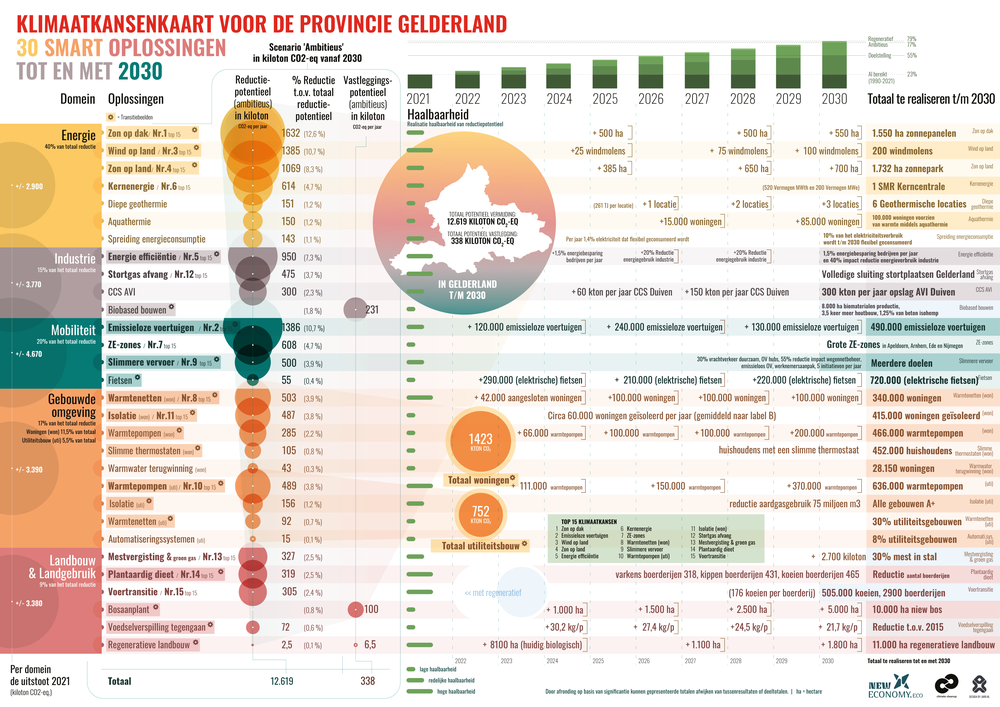
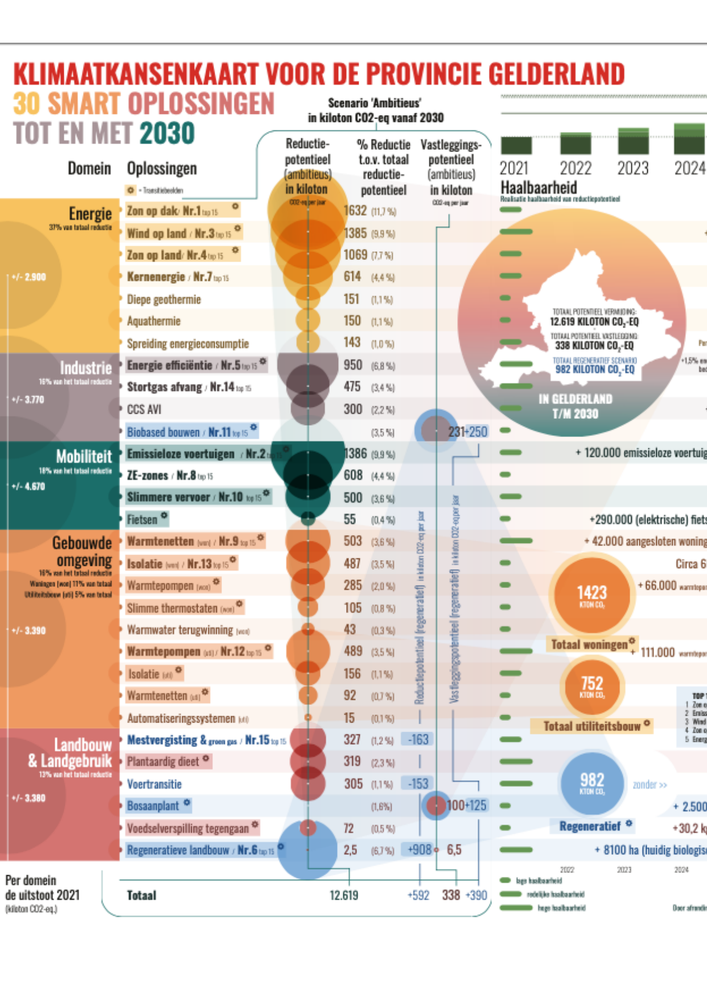
- The energy domain offers by far the largest reduction potential: up to 5.1 Mt CO₂-eq in 2030 (Ambitious scenario), with rooftop solar, onshore wind and ground-mounted solar as the largest items.
One measuring stick for five sectors
The climate opportunities map follows the Drawdown methodology: a structured way of ranking proven climate solutions by their contribution to greenhouse gas reduction and carbon sequestration. Five sectors were modelled for Gelderland: energy, built environment, agriculture and land use, mobility, and industry.
Unlike the earlier Climate Action Recap (PCSA), which focused on non-energy greenhouse gases, this map broadens the picture with energy-related emissions. As a result, reduction and sequestration are set out side by side across the full breadth of Gelderland’s task.
Reduction versus sequestration. Reduction prevents greenhouse gases from being created or released. Sequestration removes CO₂ from the air and stores it long-term in soil, biomass or long-lived materials. Some solutions do both.
Five sectors at a glance
Each sector has its own deep-dive page with the full analysis, all solutions, scenarios and sources. The headline figure per card is the reduction potential in 2030 (Ambitious scenario). Energy emissions are attributed to the end-use sectors; the energy domain bundles the solutions for generation and infrastructure.
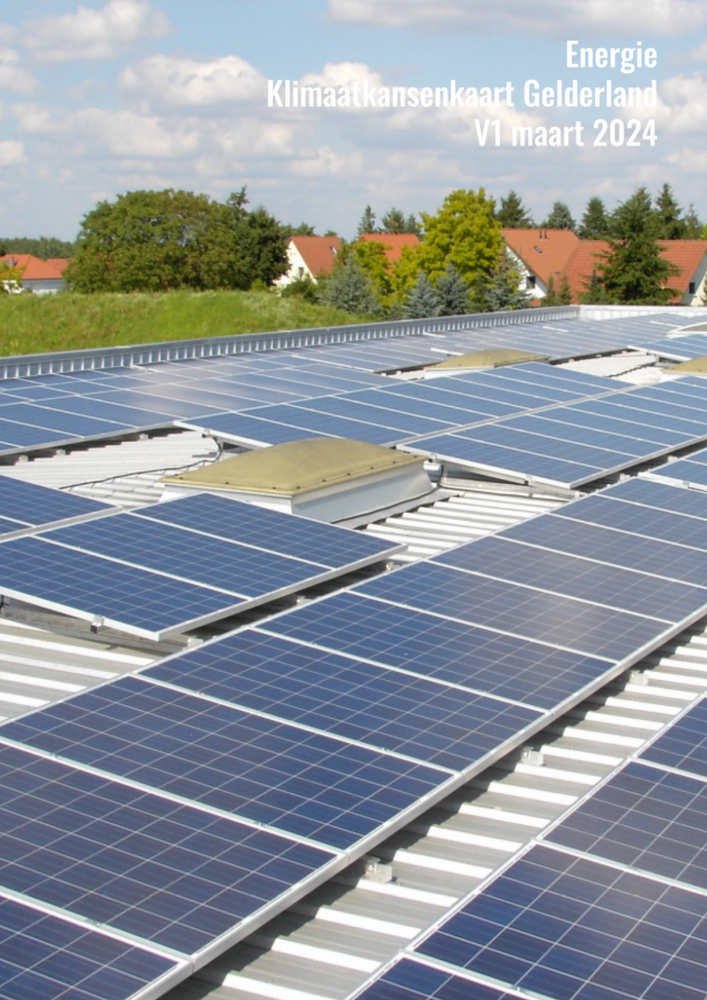
Energy
Energy production and use: energy-related emissions and the opportunities for savings and decarbonisation.
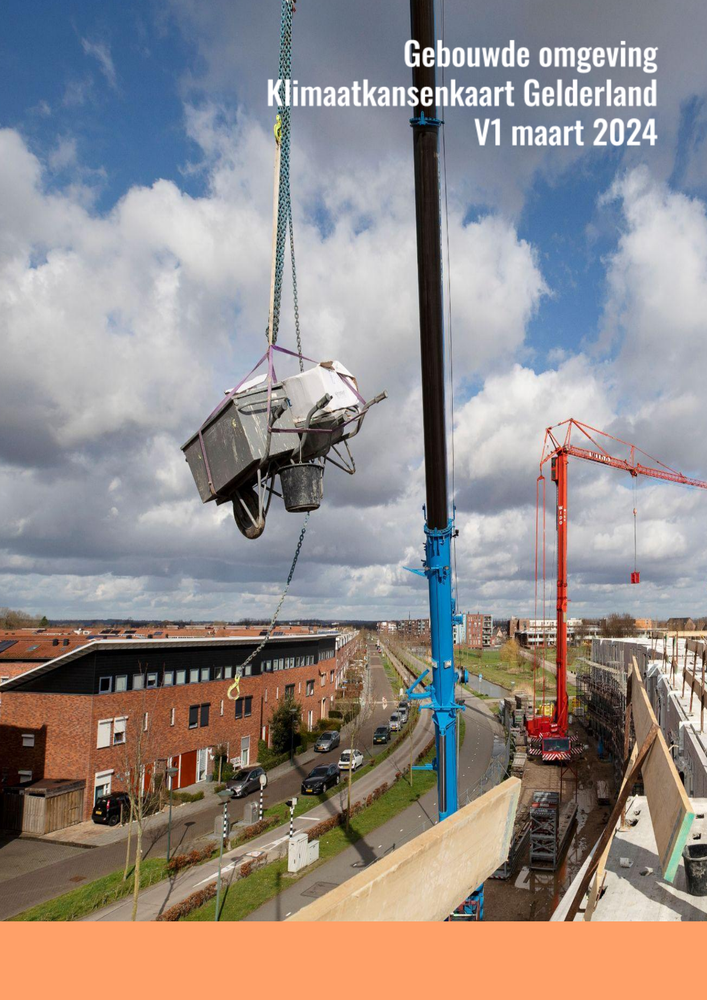
View the sector →Built environment
Heating and construction. Timber construction links the housebuilding task to long-term carbon storage in buildings.
View the sector →Agriculture & land use
Regenerative agriculture, silvopasture, biochar, and forest and soil restoration. Large reduction and sequestration potential.
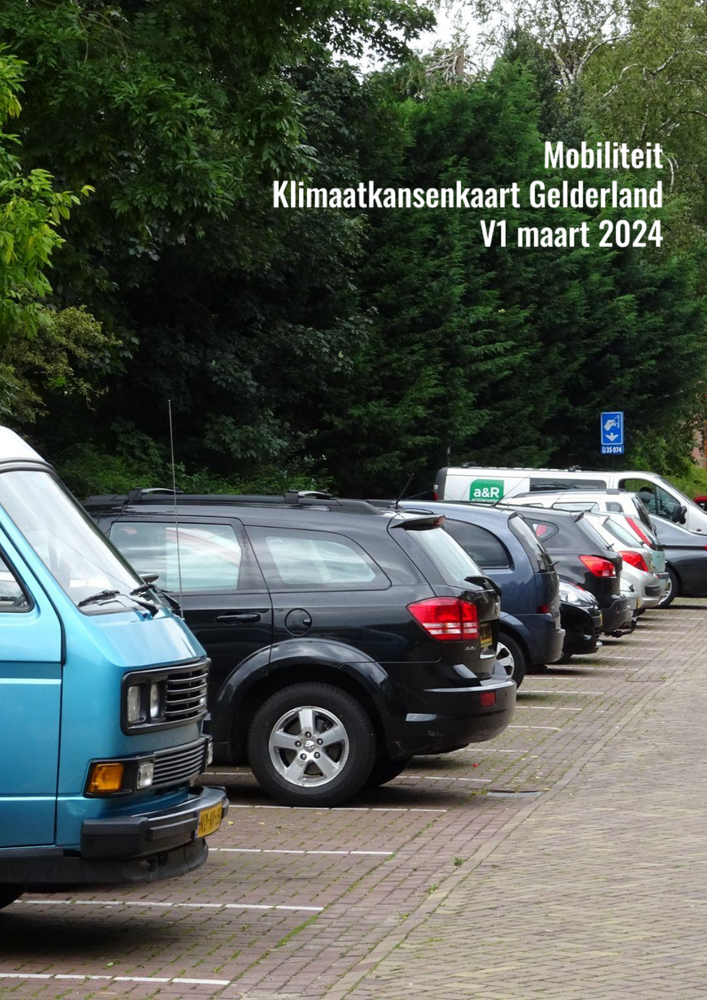
View the sector →Mobility
Passenger and freight transport: road traffic emissions and the opportunities for cleaner and less transport.
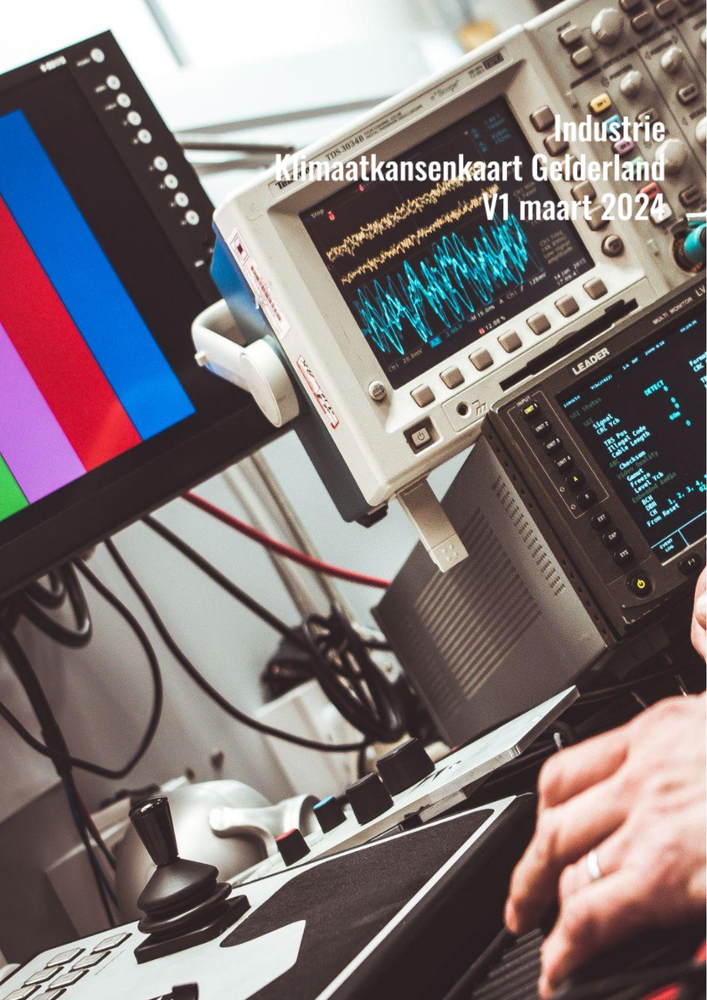
View the sector →Industry
Industry and business, with landfills and refrigerants as important non-energy sources.
View the sector →Where the leverage sits
The energy domain offers by far the largest reduction potential, followed by mobility and the built environment.
Focusing on the largest sources delivers the most return per euro and per hectare. The deep-dive pages make concrete, per sector, which solutions have the most effect and in which scenarios.
Method and sources
The analysis combines the Drawdown methodology (Project Drawdown) with an analysis of Gelderland’s greenhouse gas emissions by sector. Reduction and sequestration potential were calculated per solution in three scenarios (Estimate, Ambitious and Regenerative), based on public datasets (Emission Registration and the Regional Climate Monitor), sector benchmarks and Gelderland’s climate policy. The full assumptions, system boundaries and source references are set out in the PDFs.
Indicative, for prioritisation. Assumptions, system boundaries and source references are set out in full in the PDFs. The figures organise opportunities and are not project-specific guarantees. Free to use under CC BY 4.0, with attribution.

Insights from this project
Frequently asked questions
A climate opportunities map is a regional climate plan with measurable opportunities per sector. New Economy calculates, per sector, which climate solutions reduce and sequester the most CO₂-eq, connecting reduction to carbon sequestration. The map for Gelderland is an example of this approach.
The Climate Action Recap (PCSA) ranked the non-energy climate solutions for Gelderland using the Drawdown methodology. This climate opportunities map is the follow-up and broadens the picture to five sectors, including energy-related emissions.
Five sectors: energy, built environment, agriculture and land use, mobility, and industry.
Reduction prevents greenhouse gases from being created or released. Sequestration removes CO₂ from the air and stores it long-term in soil, biomass or long-lived materials. Some solutions do both.
The biggest opportunity lies in the sectors with the highest reduction and sequestration potential. The deep-dive pages make this concrete per sector, with conservative and progressive scenarios.
New Economy develops quantified climate opportunities maps for provinces, municipalities and regions, based on the Drawdown methodology, the GHG Protocol and science based targets.
Frequently asked questions about Gelderland’s climate opportunities
According to this opportunities analysis, Gelderland emitted 18.1 Mt CO₂-eq in 2021; this is the baseline against which all the sector opportunities are set.
The province aims for 55% less than in 1990, which this analysis puts at a reduction of 7.5 Mt CO₂-eq towards 2030.
In this opportunities analysis (Ambitious scenario, 2030), energy accounts for 5.1 Mt, mobility 2.5 Mt, the built environment 2.2 Mt, industry 1.7 Mt and agriculture and land use 1.0 Mt CO₂-eq.
Energy is the largest single lever at 5.1 Mt; according to this analysis, focusing on the largest sources delivers the most return per euro and per hectare.
This analysis works with three scenarios: Estimate, Ambitious and Regenerative, so a conservative and a progressive estimate sit side by side.
According to this analysis, the map combines the Drawdown methodology with Gelderland’s greenhouse gas emissions by sector, drawing on public datasets such as Emission Registration and the Regional Climate Monitor.
This opportunities analysis helps a province, municipality, investor or business see where action pays off most, per sector and per solution.
Yes, the figures in this analysis are free to use under CC BY 4.0 with attribution; they organise opportunities and are not project-specific guarantees.
Further reading
A climate opportunities map for your region?
From analysis to a concrete, quantified action plan for a province, municipality, supply chain or company.
View the approach