
Mobility in Gelderland’s climate opportunities map
Mobility accounts for around 26% of Gelderland’s greenhouse gas emissions, some 4.7 Mt CO₂-eq per year. Four promising solutions were identified within this domain — zero-emission vehicles, zero-emission zones, smarter transport and cycling — with a combined potential of 536 to 2,549 kt CO₂-eq reduction in 2030. Part of the Gelderland Climate Opportunities Map and the Climate Action Recap service.
Opportunities in mobility
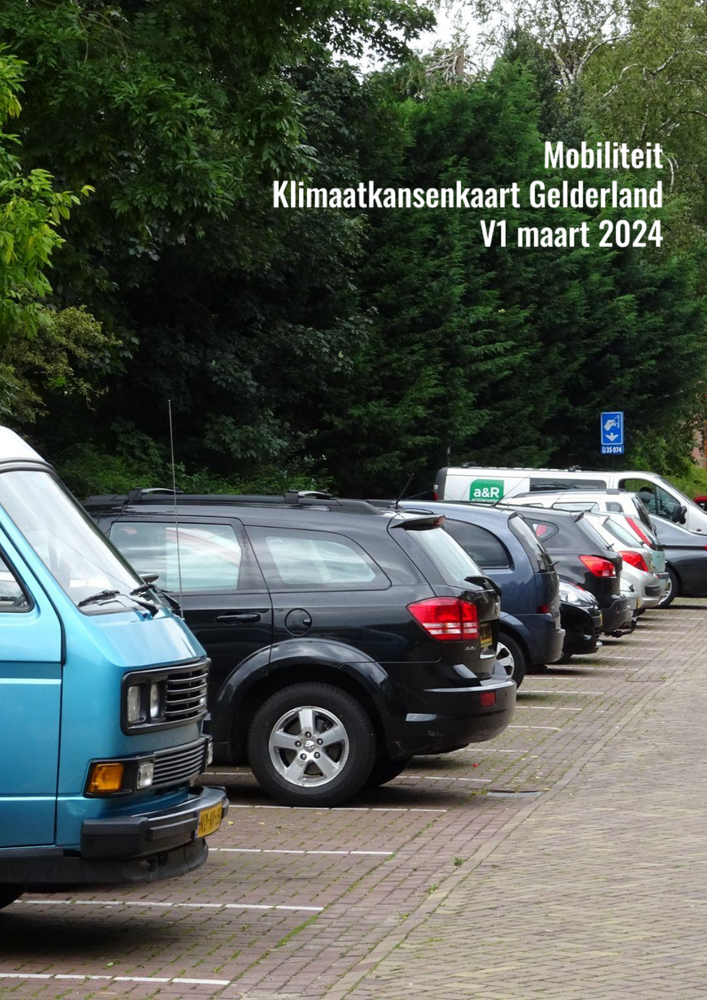
The largest share — around 90% — of emissions is attributable to road traffic exhaust: passenger cars, vans and trucks. Mobile machinery contributes the second largest share, at just over 5%. The biggest gains lie in electrification, combined with zero-emission zones and smarter travel, with cycling as a healthy, space-efficient addition.
About this sector analysis
- Prepared for
- Province of Gelderland.
- Part of
- The Gelderland Climate Opportunities Map (five sectors).
- The question
- Which mobility solutions deliver the most CO₂ reduction in Gelderland by 2030, and how do they relate to the province’s climate targets?
- Method
- The Drawdown methodology, applied to mobility emissions in Gelderland.
- Most notable result
- Zero-emission vehicles form the largest single solution (up to 1,386 kt), but within mobility, integration matters: one mode of transport replaces another, so a plurality of solutions is required.
The challenge in mobility
The Province of Gelderland faces the challenge of reducing greenhouse gases by 55% relative to the 1990 baseline; current emissions stand at 18.1 Mt CO₂-eq, of which at least 7.5 Mt must be reduced. Mobility accounts for around 4.7 Mt per year of this. By far the largest share — roughly 90% — comes from road traffic exhaust; mobile machinery follows at just over 5%.
The number of kilometres travelled by passenger and freight transport has risen by 10% over ten years, with a 15% increase in road-network emissions over the past 20 years. Gelderland also has a strong position in the logistics sector and above-average travel distances. Reducing emissions requires a broad set of solutions; this needs to go further than simply replacing fuel-powered vehicles with zero-emission vehicles.
Reduction versus sequestration. Reduction prevents greenhouse gases from being created or released. Sequestration removes CO₂ from the air and stores it long-term in soil, biomass or long-lived materials. Some solutions do both.
Solutions in brief
Four promising clusters were modelled within the mobility domain. Electrification delivers the largest potential, but the solutions reinforce each other: zero-emission zones accelerate electrification, smarter transport lowers total demand, and cycling replaces short car trips. The reduction shown is the range between the Estimate and Ambitious scenarios; mobility has no sequestration potential. A closer breakdown of each solution follows below.
| Solution | Reduction (Mt/yr, 2030) | Sequestration (Mt/yr, 2030) | Core |
|---|---|---|---|
| Zero-emission vehicles | 0.25 – 1.39 | — | From just over 8% to 20% (Estimate) or 46% (Ambitious) electric. |
| Zero-emission zones | 0.15 – 0.61 | — | Zones in Apeldoorn, Nijmegen, Ede and Arnhem. |
| Smarter transport | 0.10 – 0.50 | — | Hubs, bundled logistics, employer approach, emission-free road maintenance. |
| Cycling | 0.03 – 0.06 | — | Up to around 720,000 e-bikes plus improved cycling infrastructure. |
Zero-emission vehicles
The key starting point is the overall share of zero-emission vehicles in Gelderland. The total number of cars is 1,067,820, and the electric share currently stands at just over 8%. In the Estimate scenario, this grows to 20% by 2030; in the Ambitious scenario, to 46%. The reduction per replaced vehicle is around 64% (0.124 kg CO₂-eq per vehicle-kilometre, well-to-wheel), rising to more than 80% as the 2030 energy transition targets are met and cars are charged with cleaner electricity.
| Number of zero-emission vehicles | Estimate (20% by 2030) | Ambitious (46% by 2030) |
|---|---|---|
| 2025 | around 125,000 | around 175,000 |
| 2028 | around 175,000 | around 300,000 |
| 2030 | around 215,000 | around 500,000 |
Reduction potential: 253 kt (Estimate) to 1,386 kt (Ambitious) CO₂-eq per year in 2030 — the largest single mobility solution.
Zero-emission zones
Zero-emission zones are being introduced in the province’s four largest cities: Apeldoorn, Nijmegen, Ede and Arnhem. In the Estimate scenario, these are small zones in the inner-city areas; in the Ambitious scenario, the surrounding neighbourhoods are added. Zero-emission zones mainly affect passenger transport, but also the emissions of (heavy) commercial vehicles. The analysis is based on the average number of kilometres per resident, half of which is met through cleaner transport and half through less passenger transport.
| Average per resident | Estimate | Ambitious |
|---|---|---|
| 2025 | 143 km | 598 km |
| 2027 | 286 km | 1,196 km |
| 2030 | 500 km | 2,093 km |
Reduction potential: 152 kt (Estimate) to 608 kt (Ambitious) CO₂-eq per year — the second largest solution.
Smarter transport
Smarter transport covers a package of measures that can reduce emissions across a wide range of transport modes, based on the reduction potential from Gelderland’s climate plan: bundling flows, reducing trips in logistics, and Clean Energy Hubs for road transport and inland shipping. A province-wide network of hubs encourages travellers to travel smart and clean, by bike or public transport. In addition, the province is pursuing an employer approach, carrying out maintenance and management of provincial roads with a 55% CO₂ reduction, and supporting and strengthening community initiatives that contribute to reducing mobility emissions.
Reduction potential: 100 kt (Estimate) to 500 kt (Ambitious) CO₂-eq per year.
Cycling
The cycling solution consists both of growth in (electric) bicycles and the construction of cycling infrastructure that replaces car trips. The total number of electric bicycles grows to around 720,000 by 2030. For every e-bike sold, commuting by car decreases, and improved cycling infrastructure reduces the number of car-kilometres driven per person.
| Reduction in car-kilometres | Estimate | Ambitious |
|---|---|---|
| Per e-bike sold (commuting) | 195 km/yr | 312 km/yr |
| Improved cycling infrastructure | 38 km/person | 77 km/person |
Reduction potential: 31 kt (Estimate) to 55 kt (Ambitious) CO₂-eq per year.
Two scenarios
In the Estimate scenario, all expected emission reductions are included that can either be achieved through active policy or are considered realistic given recent market developments. The Ambitious scenario adds further ambitions on top of this. The difference is substantial: from 536 to 2,549 kt CO₂-eq per year, driven mainly by a higher share of electric cars and wider zero-emission zones.
Conservative
Estimate: around 20% of cars electric, small zero-emission zones in the inner cities of four municipalities, and the first smarter-transport and cycling measures. Together 536 kt CO₂-eq per year.
Progressive
Ambitious: 46% of cars electric, zero-emission zones extending into surrounding neighbourhoods, a full smarter-transport package and strong growth in e-bikes. Together 2,549 kt CO₂-eq per year.
Transition outlook and transformation
The mobility transition is closely tied to the energy transition: sustainably generated electricity makes zero-emission transport possible, while electric vehicles also form a buffer for the energy system by absorbing peaks and troughs in generation. A further accelerator lies in exponentially falling battery prices and self-driving shared vehicles: once these break through, the price per kilometre will fall well below that of a private car, enabling more mobility for less money and with far fewer cars.
Replacing vehicles alone is not enough. Because of the law of constant travel time and trips (the so-called BREVER law, an average of 73 minutes of travel per day) and the Jevons paradox, faster or cheaper mobility can actually increase total traffic. An integrated transition outlook with a diversity of solutions is therefore needed, one that takes health into account: as much as possible on foot within residential areas, and beyond that the bicycle, the train or a clean shared car.
Method and sources
The analysis follows the Drawdown methodology (Project Drawdown), applied to Gelderland’s mobility emissions. Reduction and sequestration potential were calculated per solution in conservative and progressive scenarios, based on public datasets, sector benchmarks and Gelderland’s climate policy. The full assumptions, system boundaries and source references are set out in the PDF.
Indicative, for prioritisation. The figures organise opportunities and are not project-specific guarantees. Free to use under CC BY 4.0, with attribution.
Insights from this project
Frequently asked questions
Four promising solutions have been identified within the mobility domain: cycling, electric vehicles, zero-emission zones and smarter transport. Together, these solutions have the potential to reduce CO₂-eq emissions by between 536 and 2,549 kt in 2030.
In the Estimate scenario, this amounts to 536 kt CO₂-eq per year; in the Ambitious scenario, 2,549 kt (2.5 Mt). Zero-emission vehicles (up to 1,386 kt) and zero-emission zones (up to 608 kt) deliver the largest share. Mobility does not sequester any CO₂; the potential lies entirely in reduction.
Reduction prevents greenhouse gases from being created or released. Sequestration removes CO₂ from the air and stores it long-term in soil, biomass or long-lived materials. Some solutions do both.
This sector analysis is part of the Gelderland Climate Opportunities Map, which sets out five sectors side by side: energy, built environment, agriculture and land use, mobility and industry.
Frequently asked questions about climate opportunities in mobility
According to this sector analysis, around 90% comes from road traffic exhaust — passenger cars, vans and trucks — with mobile machinery the second contributor at just over 5%.
Zero-emission vehicles are the largest single solution: this analysis shows 253 kt (Estimate) to 1,386 kt (Ambitious) CO₂-eq per year in 2030.
In this analysis, the electric share grows from just over 8% today to 20% (Estimate) or 46% (Ambitious) by 2030, around 215,000 to 500,000 of the 1,067,820 cars.
According to this analysis, zero-emission zones are the second largest solution at 152 to 608 kt; they are introduced in the four largest cities: Apeldoorn, Nijmegen, Ede and Arnhem.
In this analysis, 100 to 500 kt CO₂-eq per year, through hubs, bundled logistics, the employer approach and emission-free management of provincial roads.
Yes; according to this analysis, cycling delivers 31 to 55 kt, with up to around 720,000 e-bikes and improved cycling infrastructure that replaces car trips.
No; according to this analysis, because of the BREVER law (an average of 73 minutes of travel per day) and the Jevons paradox, faster or cheaper mobility can actually increase traffic, so an integrated set of solutions is needed.
According to this analysis, the reduction potential ranges from 536 kt (0.5 Mt) in the Estimate to 2,549 kt (2.5 Mt) in the Ambitious scenario, driven mainly by more electric cars and wider zero-emission zones.
Further reading
A climate opportunities map for your region?
From analysis to a concrete, quantified action plan for a province, municipality, supply chain or company.
View the approach