
Built environment in Gelderland’s climate opportunities map
The built environment accounted for around 5 Mt CO₂-eq in Gelderland in 2021, roughly 28% of the province’s emissions. Nine climate solutions together bring a reduction potential of 1.0 to 2.2 Mt CO₂-eq in 2030 into view. Part of the Gelderland Climate Opportunities Map and the Climate Action Recap service.
Opportunities in the built environment
Insulation, heat pumps and heat networks form the core. In the Estimate scenario, this amounts to 1,049 kt CO₂-eq reduction; in the Ambitious scenario, 2,174 kt. The three largest opportunities: heat networks for homes (503 kt), heat pumps in utility buildings (489 kt) and insulation of homes (487 kt).
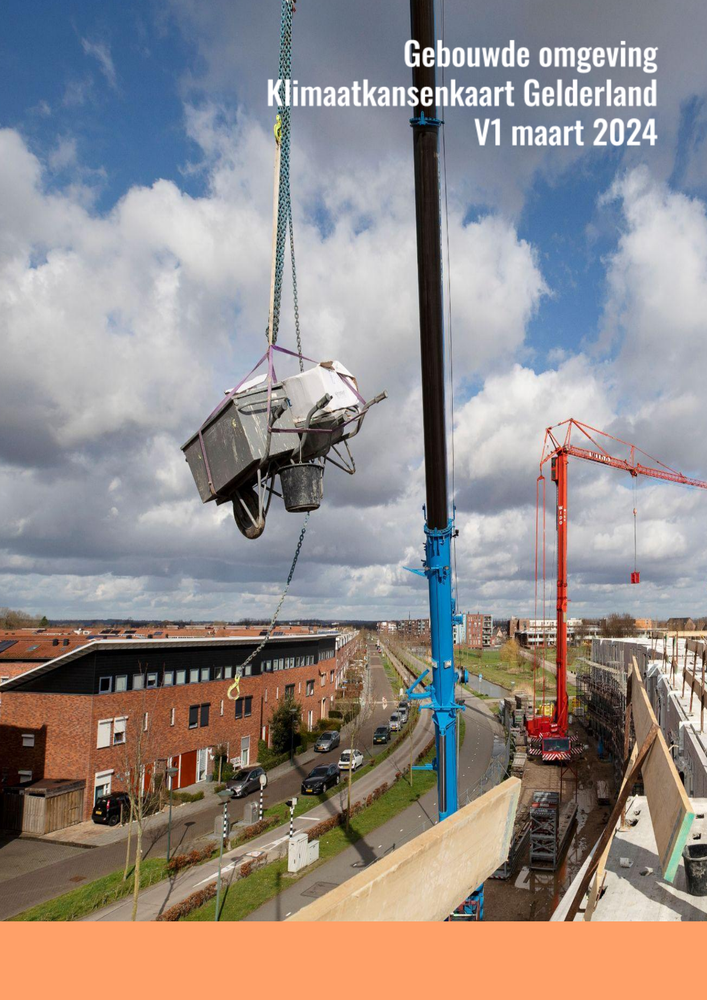
About this sector analysis
- Prepared for
- Province of Gelderland.
- Part of
- The Gelderland Climate Opportunities Map (five sectors).
- The question
- Which climate solutions reduce emissions from Gelderland’s built environment the fastest, and how much CO₂-eq do they deliver towards 2030?
- Method
- The Drawdown methodology, applied to built-environment emissions in Gelderland.
- Most notable result
- Heat networks for homes form the largest single opportunity at 503 kt CO₂-eq; together with heat pumps and insulation, a reduction of up to 2,174 kt CO₂-eq is possible by 2030.
The challenge in the built environment
Emissions from the built environment in Gelderland come mainly from natural gas and electricity used to heat, cool and light homes and utility buildings. The largest source is consumer energy use through gas boilers, followed by electricity consumption in households and utility buildings. The largest task lies in the existing building stock: for new construction, net-zero-on-the-meter is close to standard, while older buildings need to reach at least energy label B.
Gelderland has translated this ambition into a retrofit task covering 500,000 homes. 415,000 homes can be further insulated, and there is room for 466,000 heat pumps in housing alone. That means an average of 200 to 250 retrofitted homes every working day, an annual task of nearly 60,000 homes. Grid congestion and a shortage of installation and construction capacity are the main obstacles.
Reduction versus sequestration. Reduction prevents greenhouse gases from being created or released. Sequestration removes CO₂ from the air and stores it long-term in soil, biomass or long-lived materials. Some solutions do both.
The solutions at a glance
Nine solutions were modelled for homes and utility buildings. The three with the largest reduction potential are shown below; insulation with biobased materials also lowers energy demand and stores CO₂.
| Solution | Reduction (Mt/yr, 2030) | Sequestration (Mt/yr, 2030) | Explanation |
|---|---|---|---|
| Heat networks (homes) | 0.24–0.50 | – | Connection to sustainable heat from deep geothermal and aquathermal sources; the share of heat networks grows from around 5% to 20–37% of heat demand. |
| Heat pumps (utility buildings) | 0.12–0.49 | – | Electrification of heating and cooling; up to 635,000 heat pumps in utility buildings by 2030 in the Ambitious scenario. |
| Insulation (homes) | 0.38–0.49 | biobased | 415,000 homes to at least energy label B; biobased insulation (hemp, flax, wood) lowers energy demand and stores CO₂. |
Two scenarios
The analysis works with two scenarios. Estimate contains the reduction achievable with existing policy and market development. Ambitious adds acceleration, for example a faster-growing share of heat networks and more heat pumps in utility buildings. Between the two scenarios lies 1,125 kt CO₂-eq of additional potential.
Conservative
Estimate: 1,049 kt CO₂-eq reduction with existing policy and current market growth, mainly through insulation of homes (380 kt) and heat networks for homes (244 kt).
Progressive
Ambitious: 2,174 kt CO₂-eq with accelerated roll-out, with heat networks for homes (503 kt), heat pumps in utility buildings (489 kt) and insulation of homes (487 kt) as the largest items.
Method and sources
The analysis follows the Drawdown methodology (Project Drawdown), applied to Gelderland’s built-environment emissions. Reduction and sequestration potential were calculated per solution in conservative and progressive scenarios, based on public datasets, sector benchmarks and Gelderland’s climate policy. The full assumptions, system boundaries and source references are set out in the PDF.
Indicative, for prioritisation. The figures organise opportunities and are not project-specific guarantees. Free to use under CC BY 4.0, with attribution.
Insights from this project
Frequently asked questions
The largest opportunities are heat networks for homes, heat pumps in utility buildings and insulation of homes. Together with smart thermostats, heat recovery and building automation systems, nine solutions have been modelled for homes and utility buildings.
In the Estimate scenario, this amounts to 1,049 kt CO₂-eq reduction; in the Ambitious scenario, 2,174 kt CO₂-eq (around 1.0 to 2.2 Mt) by 2030. The built environment accounted for around 5 Mt CO₂-eq in 2021, roughly 28% of Gelderland’s emissions.
Reduction prevents greenhouse gases from being created or released. Sequestration removes CO₂ from the air and stores it long-term in soil, biomass or long-lived materials. Some solutions do both.
This sector analysis is part of the Gelderland Climate Opportunities Map, which sets out five sectors side by side: energy, built environment, agriculture and land use, mobility and industry.
Frequently asked questions about climate opportunities in the built environment
According to this sector analysis, mainly from natural gas and electricity used for heating, cooling and lighting; the largest source is consumer energy use through gas boilers, followed by electricity use in households and utility buildings.
Heat networks for homes are the largest single opportunity in this analysis, at 503 kt CO₂-eq in 2030 in the Ambitious scenario.
In this analysis, 0.12 to 0.49 Mt CO₂-eq in 2030, with up to 635,000 heat pumps in utility buildings in the Ambitious scenario.
According to this analysis, the task covers 500,000 homes; 415,000 can be further insulated and there is room for 466,000 heat pumps, together an average of 200 to 250 homes per working day.
Yes; this analysis shows that insulating homes delivers 0.38 to 0.49 Mt by bringing 415,000 homes to at least label B, while biobased insulation from hemp, flax and wood lowers energy demand and stores CO₂.
In this analysis, the share of heat networks grows from around 5% to 20-37% of heat demand, fed by sustainable heat from deep geothermal and aquathermal sources, good for 0.24 to 0.50 Mt.
According to this analysis, grid congestion and a shortage of installation and construction capacity are the main obstacles.
According to this analysis, the reduction ranges from 1,049 kt (Estimate) to 2,174 kt (Ambitious) in 2030, a difference of 1,125 kt, driven partly by more heat networks and heat pumps.
Further reading
A climate opportunities map for your region?
From analysis to a concrete, quantified action plan for a province, municipality, supply chain or company.
View the approach