
Energy in Gelderland’s climate opportunities map
Energy is the domain of large-scale power generation and energy infrastructure in the Gelderland Climate Opportunities Map. Seven solutions were explored for this domain, with a combined potential to reduce CO₂ emissions by between 3.3 and 5.1 Mt in 2030. Part of the Gelderland Climate Opportunities Map and the Climate Action Recap service.
Opportunities in energy
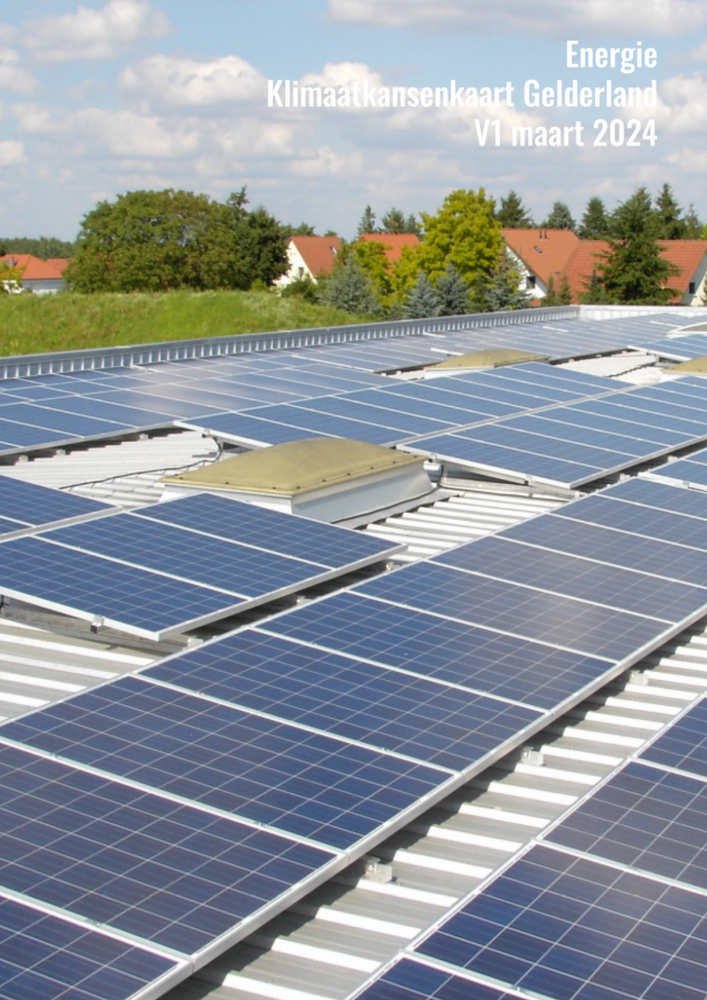
Since the coal- and biomass-fired power plant in Nijmegen was demolished in 2015, the Province of Gelderland has had no coal or gas power stations generating electricity. This means no emissions reduction can be achieved within Gelderland from electricity generation itself. The gains lie in more renewable generation within the province; rooftop solar, onshore wind and ground-mounted solar together form the largest share of the reduction potential.
About this sector analysis
- Prepared for
- Province of Gelderland.
- Part of
- The Gelderland Climate Opportunities Map (five sectors).
- The question
- Which climate solutions reduce Gelderland’s energy emissions the most, and how much CO₂-eq do they deliver towards 2030?
- Method
- The Drawdown methodology, applied to energy emissions in Gelderland.
- Most notable result
- Because the Province of Gelderland is a net importer of electricity, the total avoidance potential is higher than the emissions from generation within the province itself. Energy therefore has almost no emissions of its own, yet the largest reduction potential of the five sectors: up to 5.1 Mt CO₂-eq in 2030.
The challenge in energy
The energy domain covers large-scale electricity generation and energy infrastructure. Since the coal- and biomass-fired power plant in Nijmegen was demolished in 2015, the Province of Gelderland has had no coal or gas power stations generating electricity. However, Gelderland still uses substantial amounts of energy originating from coal- or gas-fired plants elsewhere. The region is therefore a net importer of electricity, and is responsible for emissions that occur outside its own borders.
Within the RES regions, the focus is on large-scale local generation of renewable electricity. This will shift electricity use away from imports from outside the region towards local generation for local demand. The grid does not yet appear able to absorb the sharp increase in electricity, on both the demand and supply side; grid congestion is rising, driven in particular by the strong growth of solar power. As a result, the energy domain becomes an ‘enabler’ for the other domains: more renewable generation also greens the electricity used by the built environment, mobility and industry.
Reduction versus sequestration. Reduction prevents greenhouse gases from being created or released. Sequestration removes CO₂ from the air and stores it long-term in soil, biomass or long-lived materials. Some solutions do both.
Potential by solution
A total of seven solutions were explored for the energy domain. Together, they have the potential to reduce CO₂ emissions by between 3.3 and 5.1 Mt in 2030. The table below sets out the reduction potential per solution for both scenarios; an explanation of each solution follows below.
| Solution | Estimate (kt CO₂-eq) | Ambitious (kt CO₂-eq) |
|---|---|---|
| Solar on roofs | 1,306 | 1,632 |
| Onshore wind | 885 | 1,385 |
| Ground-mounted solar | 855 | 1,069 |
| Nuclear energy | 0 | 614 |
| Deep geothermal | 75 | 151 |
| Aquathermal energy | 75 | 150 |
| Spreading energy demand | 71 | 143 |
| Total | 3,267 | 5,143 |
Solar on roofs
Solar on roofs is the single largest solution: 1,306 kt CO₂-eq in the Estimate scenario and 1,632 kt in the Ambitious scenario. The designated areas are not always known from the RES plans, but there is substantial potential for rooftop solar on both business parks and government buildings. In the Ambitious scenario, around 500 hectares are installed by 2025, around 1,000 hectares by 2028 and around 1,550 hectares in total by 2030, on the roofs of the roughly 8,000 hectares in Gelderland designated as business parks. Small-scale generation under 15 kWp, such as on the roofs of private homes, falls outside this solution.
Onshore wind
Onshore wind delivers 885 kt CO₂-eq in the Estimate scenario and 1,385 kt in the Ambitious scenario. In the Ambitious scenario, this involves around 25 wind turbines (5.6 MW) by 2025, 120 by 2028 and around 200 in total by 2030. Combined with 9,000 hectares of agricultural land, energy can be produced; this is less than 5% of the agricultural land available in the province. Wind farms and solar fields generate resistance; it is crucial to make directly affected residents co-owners by letting them share in the proceeds. To achieve results by 2030, most permits need to be granted by the end of 2025.
Ground-mounted solar
Ground-mounted solar delivers 855 kt CO₂-eq in the Estimate scenario and 1,069 kt in the Ambitious scenario. In the Ambitious scenario, around 600 hectares of solar parks are installed by 2025, around 1,200 hectares by 2028 and around 1,730 hectares in total by 2030. Combining water, nature and solar energy improves cooling, and initiating biodiversity programmes on land around large-scale wind and solar parks increases ecological value.
Nuclear energy
Nuclear energy contributes nothing in the Estimate scenario and 614 kt CO₂-eq in the Ambitious scenario: by 2030, a total of one SMR is built with 520 MW thermal and 200 MW electrical capacity. Nuclear energy could form part of the energy mix, but only if the cost approaches that of the solar-wind-storage system. Because of safety considerations and large capital expenditure, this is uncertain; it is also an irreversible choice with a very long lead time, including in relation to future decommissioning.
Deep geothermal
Deep geothermal delivers 75 kt CO₂-eq in the Estimate scenario and 151 kt in the Ambitious scenario. In the Ambitious scenario, geothermal energy is realised at 1 location by 2026, 3 locations by 2028 and 6 locations by 2030, averaging 261 TJ per location. Geothermal energy still offers considerable room for development, both for extracting heat and for (seasonal) storage.
Aquathermal energy
Aquathermal energy delivers 75 kt CO₂-eq in the Estimate scenario and 150 kt in the Ambitious scenario. In the Ambitious scenario, around 20,000 homes per year are connected to a heat network via aquathermal energy from 2026 onwards, reaching 100,000 homes by 2030. Heat demand accounts for a significant share of energy use; aquathermal energy uses heat extracted from surface water.
Spreading energy demand
Spreading energy demand delivers 71 kt CO₂-eq in the Estimate scenario and 143 kt in the Ambitious scenario. In the Ambitious scenario, the share of flexibly consumed electricity grows by around 1.4% per year, reaching 10% of electricity consumption by 2030. Grid flexibility can deliver a significant reduction in emissions without expanding the grid: flexible consumption of up to 30% is roughly equivalent to the potential impact of a nuclear power plant. Households and businesses can act on demand response now, since energy contracts with near-live energy prices are already available.
Two scenarios
The reduction potential has been calculated across two scenarios. The Estimate scenario includes all expected avoided emissions achievable through active policy or recent market developments. The Ambitious scenario adds further ambition on top of this, for example because this is considered achievable in other regions or by accelerating current policy. In total, a reduction potential of between 3,267 and 5,143 kt CO₂-eq was explored, a difference of 1,876 kt.
Conservative
Estimate scenario. Achievable with active policy and recent market developments, mainly through rooftop solar, ground-mounted solar and onshore wind (a combined 3,046 kt from the RES policy).
Progressive
Ambitious scenario. Total electricity supply increases by 25% relative to the RES bid, enabled by innovation and efficiency gains, supplemented by nuclear energy (1 SMR), geothermal and aquathermal energy.
Method and sources
The analysis follows the Drawdown methodology (Project Drawdown), applied to Gelderland’s energy emissions. Reduction and sequestration potential were calculated per solution in conservative and progressive scenarios, based on public datasets, sector benchmarks and Gelderland’s climate policy. The full assumptions, system boundaries and source references are set out in the PDF.
Indicative, for prioritisation. The figures organise opportunities and are not project-specific guarantees. Free to use under CC BY 4.0, with attribution.
Insights from this project
Frequently asked questions
For the energy domain, seven solutions were explored in Gelderland: rooftop solar, onshore wind, ground-mounted solar, nuclear energy, deep geothermal, aquathermal energy and spreading energy demand. Rooftop solar, onshore wind and ground-mounted solar together offer the largest reduction potential. Spreading energy demand can deliver a significant reduction in emissions without expanding the grid: flexible consumption of up to 30% is roughly equivalent to the potential impact of a nuclear power plant.
The reduction potential of energy in Gelderland ranges from 3.3 Mt CO₂-eq in the Estimate scenario to 5.1 Mt CO₂-eq in the Ambitious scenario in 2030. That is the largest reduction potential of the five sectors, even though generation within the province itself produces almost no emissions. The domain does not sequester any CO₂.
Reduction prevents greenhouse gases from being created or released. Sequestration removes CO₂ from the air and stores it long-term in soil, biomass or long-lived materials. Some solutions do both.
This sector analysis is part of the Gelderland Climate Opportunities Map, which sets out five sectors side by side: energy, built environment, agriculture and land use, mobility and industry.
Frequently asked questions about climate opportunities in energy
According to this sector analysis, Gelderland has had no coal or gas power stations since the coal- and biomass-fired plant in Nijmegen was demolished in 2015; the province is a net importer of electricity and responsible for emissions outside its own borders.
Solar on roofs is the single largest solution: this analysis shows 1,306 kt (Estimate) to 1,632 kt (Ambitious) CO₂-eq in 2030.
In this analysis, onshore wind delivers 885 to 1,385 kt and ground-mounted solar 855 to 1,069 kt CO₂-eq in 2030; onshore wind needs around 200 turbines on less than 5% of the agricultural land.
According to this analysis, nuclear energy contributes nothing in the Estimate scenario and 614 kt in the Ambitious scenario (one SMR of 520 MW thermal and 200 MW electrical), and only if its cost approaches that of solar, wind and storage.
Yes; this analysis shows that spreading energy demand delivers 71 to 143 kt without expanding the grid, and that flexible consumption of up to 30% is roughly equivalent to the impact of a nuclear power plant.
According to this analysis, the grid cannot yet absorb the sharp increase in demand and supply; grid congestion is rising, driven in particular by the strong growth of solar power.
In this analysis, around 20,000 homes are connected each year from 2026, reaching 100,000 homes by 2030, good for 75 to 150 kt CO₂-eq.
According to this analysis, the reduction potential ranges from 3.3 Mt (Estimate) to 5.1 Mt (Ambitious) in 2030, a difference of 1,876 kt, driven partly by 25% more electricity supply than the RES bid, plus nuclear, geothermal and aquathermal energy.
Further reading
A climate opportunities map for your region?
From analysis to a concrete, quantified action plan for a province, municipality, supply chain or company.
View the approach