
Climate action plan for Gelderland, sector by sector
New Economy develops quantified climate action plans for provinces and regions. This Climate Action Recap for Gelderland calculates, per sector, which climate solutions reduce and sequester the most CO₂-eq, using the Drawdown methodology. Part of the Climate Action Recap service.
Compare to be able to choose
Four sectors, one measuring stick. The analysis ranks climate solutions by their reduction and sequestration potential for 2030, so a province, municipality, investor or business can see where action pays off most. Agriculture and industry together account for 98% of non-energy emissions.
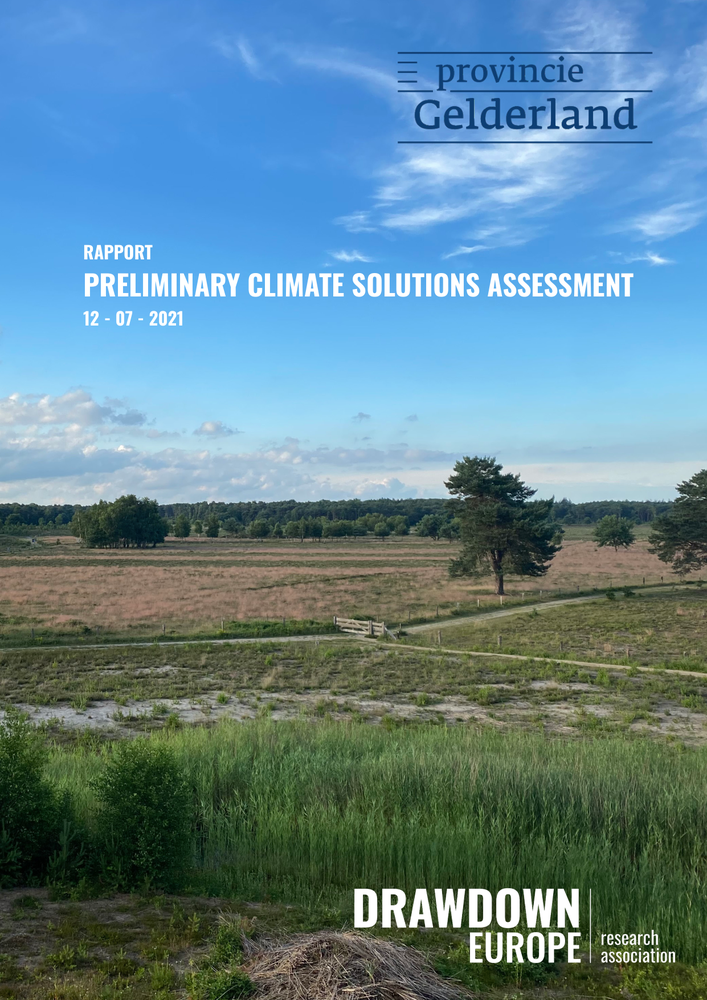
A regional climate action plan with measurable targets
A Climate Action Recap connects emission reduction with carbon removal and translates climate ambition into concrete, quantified solutions per sector. New Economy develops these plans for provinces, municipalities and regions, based on the Drawdown methodology, the GHG Protocol and science based targets. The Gelderland analysis is an example of this approach.
About this Climate Action Recap
Prepared for: the Province of Gelderland.
In collaboration with: Climate Cleanup and the Drawdown Europe Research Association (DERA).
The question: map which climate solutions reduce and sequester the most CO₂-eq per sector, so the province can prioritise action.
Method: the Drawdown methodology, combined with a Pareto analysis of Gelderland’s non-energy greenhouse gas emissions.
Most notable result: agriculture & land use and industry & business together account for 98% of non-energy emissions. That is where the greatest scope for action lies.
One measuring stick for every sector
The Climate Action Recap for Gelderland follows the Drawdown methodology: a structured way of ranking proven climate solutions by their contribution to greenhouse gas reduction and carbon sequestration. A Pareto analysis first identified the largest non-energy emission sources, then the solutions that make the most difference there.
The scope is deliberately bounded. The analysis focuses on non-energy carbon dioxide and other greenhouse gases: methane from agriculture and landfills, nitrous oxide from manure and fertiliser, and refrigerants. Energy-related emissions from burning fossil fuels fall outside this analysis, since those are addressed through other tracks.
Reduction versus sequestration. Reduction prevents greenhouse gases from being created or released. Sequestration removes CO₂ from the air and stores it long-term in soil, biomass or long-lived materials. Some solutions do both.
Four sectors compared
Agriculture & land use and industry & business carry by far the largest share of non-energy emissions. The built environment and mobility are small in share, though the built environment offers sequestration potential through timber construction.
| Sector | Share of emissions | Main source | Reduction (Drawdown, 2030) | Sequestration (Drawdown, 2030) |
|---|---|---|---|---|
| Agriculture & land use | 57% | Methane, dairy cattle fermentation | 0.298–2.549 Mt | 0.114–0.394 Mt |
| Industry & business | 41% | Methane, landfills | 0.077–1.2 Mt | 0 |
| Built environment | 1% | Methane, households | 0.02–0.1 Mt | 0.07–0.36 Mt |
| Mobility & transport | 1% | Nitrogen, road traffic | no direct solution | 0 |
Share = portion of non-energy carbon dioxide and other greenhouse gases. Reduction and sequestration ranges follow the Drawdown solutions for 2030. The Gelderland Climate Plan additionally sets sector-wide reduction targets (including energy-related emissions): agriculture 1.3–2.2 Mt, industry 1.6–2.4 Mt, built environment 1.8–3.0 Mt, mobility 1.3–2.6 Mt.
Where the leverage sits
The Pareto logic is clear: two sectors account for almost the entire non-energy challenge. Action on agriculture and industry delivers the most return per euro and per hectare.
Within agriculture, the largest reduction potential lies in a shift towards regenerative agriculture combined with a smaller livestock herd, supplemented by a more plant-based diet. Within industry, it centres on landfills: capturing landfill gas, recycling and composting lower methane emissions. The built environment adds long-term carbon storage to the housebuilding task through timber construction.
Deep dive per sector
Each sector has its own deep-dive page with the full analysis, all solutions, scenarios and sources.
Agriculture & land use
Nine solutions, from regenerative agriculture and silvopasture to biochar and forest restoration. The largest reduction and sequestration potential.
View the sector →Industry & business
Landfills as the largest source. Landfill gas capture, recycling, composting and refrigerant management.
View the sector →Built environment
Timber construction links the housebuilding task to carbon storage in buildings.
View the sector →Mobility & transport
Predominantly energy-related. Non-energy refrigerants run through the industry sector.
View the sector →Method and sources
The analysis combines the Drawdown methodology (Project Drawdown) with a Pareto analysis of Gelderland’s non-energy emissions. Reduction and sequestration potential were calculated per solution in conservative and progressive scenarios, based on public datasets, sector benchmarks and the Gelderland Climate Plan 2021–2030. For carbon sequestration in agricultural soils, research from Wageningen University & Research (Lesschen, Hendriks, Porre, 2021) was used. The Climate Action Recap for Gelderland was carried out in collaboration with Climate Cleanup and the Drawdown Europe Research Association (DERA).
Indicative, for prioritisation. Assumptions, system boundaries and source references are set out in full in the PDFs. The figures organise opportunities and are not project-specific guarantees.
The full analysis
- Climate Action Recap Gelderland (PDF) All four sectors. Download the full bundle
- Agriculture & land use (PDF) Sector analysis. Download
- Industry & business (PDF) Sector analysis. Download
- Built environment (PDF) Sector analysis. Download
- Mobility & transport (PDF) Sector analysis. Download
Insights from this project
Frequently asked questions
A Climate Action Recap is a regional climate action plan with measurable targets. New Economy calculates, per sector, which climate solutions reduce and sequester the most CO₂-eq, connecting reduction to carbon removal. The Gelderland analysis is an example of this approach.
New Economy develops quantified climate action plans for provinces, municipalities and regions, based on the Drawdown methodology, the GHG Protocol and science based targets.
Four sectors: agriculture and land use (57% of non-energy emissions), industry and business (41%), built environment (1%) and mobility and transport (1%).
Agriculture and land use. With reduction potential up to 2.549 Mt and sequestration up to 0.394 Mt CO₂-eq in 2030, this is the greatest leverage, mainly through regenerative agriculture combined with a smaller livestock herd.
The Gelderland Climate Plan sets sector-wide reduction targets, including energy-related emissions. The Climate Action Recap adds the specific potential of Drawdown solutions for non-energy emissions.
Frequently asked questions about the climate action plan for Gelderland
According to this action plan, 85% of non-energy emissions trace back to 8.5% of emission sources; in 2019 this amounted to roughly 5 Mt CO₂-eq in total.
According to this action plan, the analysis focuses on non-energy CO₂ and other greenhouse gases: methane from agriculture and landfills, nitrous oxide from manure and fertiliser, and refrigerants; energy-related emissions are excluded.
According to this action plan, of the 47 assessed Drawdown solutions, 16 emerge as promising; together they add up to 3.37 Mt CO₂-eq reduction in 2030.
According to this action plan, reduction prevents greenhouse gases from being created or released, while sequestration removes CO₂ from the air and stores it long-term in soil, biomass or long-lived materials; some solutions do both.
According to this action plan, it was prepared for the Province of Gelderland in collaboration with Climate Cleanup and the Drawdown Europe Research Association, with Quintel (Energy Transition Model) as model partner.
According to this action plan, the Climate Action Recap for Gelderland was published on 12 July 2021.
According to this action plan, agriculture and industry together account for 98% of non-energy emissions, so action there delivers the most return per euro and per hectare.
According to this action plan, the Gelderland Climate Plan sets sector-wide targets including energy-related emissions: agriculture 1.3 to 2.2 Mt, industry 1.6 to 2.4 Mt, built environment 1.8 to 3.0 Mt and mobility 1.3 to 2.6 Mt CO₂-eq.
Further reading
A climate action plan for your region?
From Pareto analysis to a concrete, quantified action plan for a province, municipality, supply chain or company.
View the approach