Climate opportunities Gelderland: where does the province stand now?
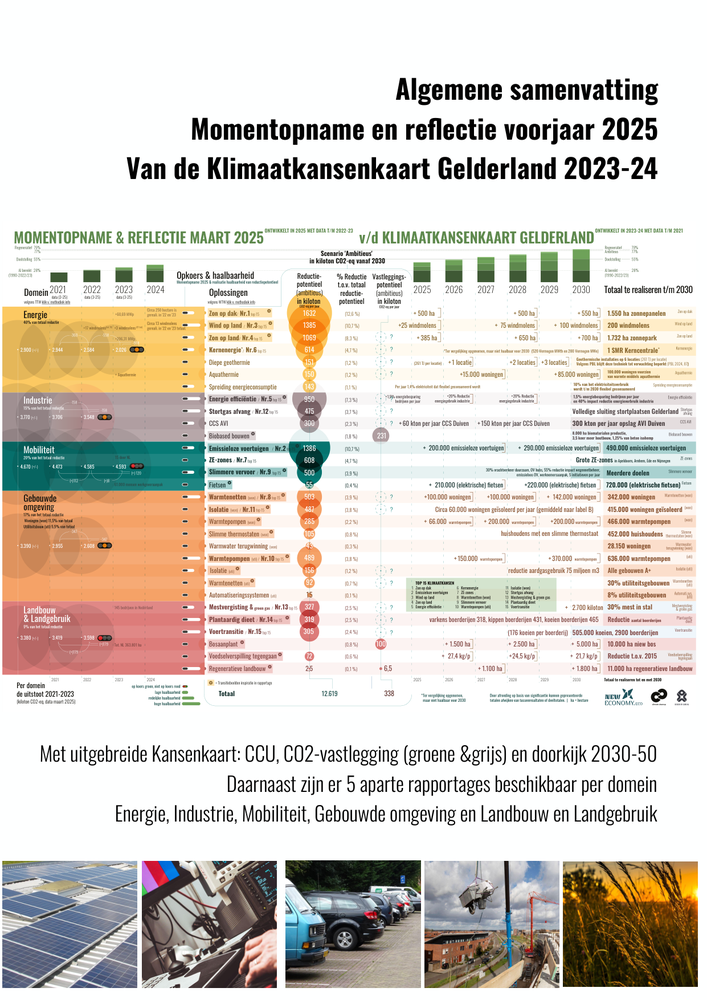
The Snapshot & Reflection 2025 shows how much progress Gelderland has made since the Climate Opportunities Map Gelderland 2023-2024. The page brings implementation, traction, the remaining gap and carbon sequestration together in one progress layer.
Measure and reflect on implementation
The 2025 publication does not replace the Climate Opportunities Map Gelderland 2023-2024. The 2024 layer remains the planning and potential layer with 30 SMART solutions. This snapshot adds the progress picture: what has been realised, where traction is visible and where the gap towards 2030 remains.
Three layers over time
Published in March 2025. The analysis is based on emissions data through 2022 and 2023. Registration data trails the moment of publication by several years, so each publication uses the most recent fully available data years. This snapshot reflects on the Climate Opportunities Map Gelderland 2023-2024, which was based on data through 2021.
| Publication | Published | Data through | Role |
|---|---|---|---|
| PCSA Gelderland | 2021 | around 2019-2020 | First exploration of non-energy-related solutions. |
| Climate Opportunities Map Gelderland 2023-2024 | March 2024 | 2021 | Planning and potential layer with 30 SMART solutions. |
| Snapshot & Reflection 2025 | March 2025 | 2022-2023 | Progress layer with implementation, traction and the remaining gap. |
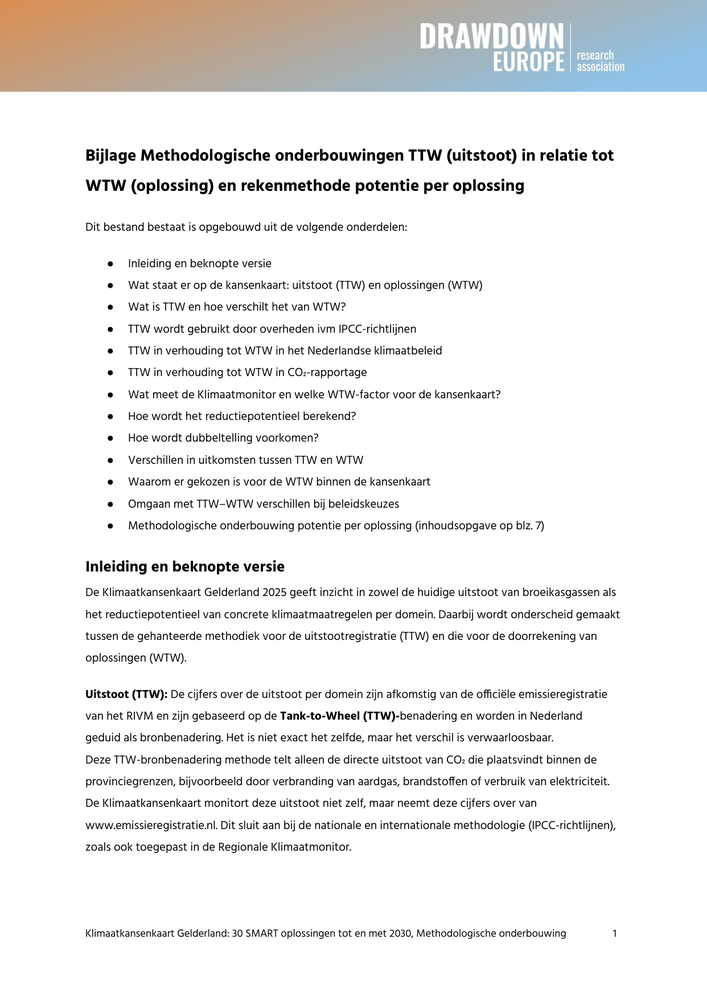
TTW for emissions, WTW for reduction potential
- Emissions
- Direct emissions within the provincial boundary, using TTW: Tank-to-Wheel. Main source: emissieregistratie.nl.
- Reduction potential
- Full chain emissions, using WTW: Well-to-Wheel. This includes emissions from source to use.
- Difference
- WTW is around 5 to 10% higher than TTW. For Gelderland, this is around 9% in the projection scenario and around 5% in the ambitious scenario.
- Double counting
- Double counting is avoided. Only implemented measures count as solutions.
- Further detail
- Method page on TTW versus WTW follows as a separate transparency page.
From potential to progress
The solutions model is largely stable compared with the Climate Opportunities Map Gelderland 2023-2024. The distinctive value of the Snapshot & Reflection 2025 therefore does not lie in a new potential map, but in the progress measurement: where implementation is becoming visible and where the pace remains insufficient.
Progress layer. The 2025 page shows implementation, traction and the remaining gap. The 2024 page remains the planning and potential layer.
Five domains compared
Implementation differs strongly by domain. Energy and the built environment show a clear decline. Mobility is still rising, agriculture and land use are stagnating, and industry lags behind the national picture.
| Domain | Emissions 2021-2023 | Share of 2030 potential realised | Top reduction solution |
|---|---|---|---|
| Energy | around -31% (2.94 to 2.03 Mton) | around 31% realised, around 69% remains | Solar on roofs: 1,632 kton CO₂-eq/year |
| Built environment | around -23% | around 23% realised, 77% open | Residential heat networks: 503 kton CO₂-eq/year |
| Industry | around -4.3% (2021-2022) | the majority remains | Energy efficiency: 950 kton CO₂-eq/year |
| Mobility | still rising | around 0% used, practically 100% remains | Zero-emission vehicles: 1,386 kton CO₂-eq/year |
| Agriculture and land use | around +5% (2021-2022) | the majority remains | Manure digestion and green gas: 327 kton CO₂-eq/year |
The pathway towards 2030
Gelderland has achieved a 28% reduction compared with 1990. The 2030 target is 55%. The full ambitious scenario reaches a 77% reduction, and the regenerative scenario reaches 79%.
| Pathway | Reduction compared with 1990 | Interpretation |
|---|---|---|
| Already achieved | 28% | Realised reduction through 2022/2023. |
| 2030 target | 55% | Provincial reduction target. |
| Full ambitious scenario | 77% | Scenario with full realisation of the ambitious potential. |
| Regenerative scenario | 79% | Scenario with additional regenerative action. |
What is moving, what is lagging
Rapid growth in renewable energy leads to more than 30% reduction in two years. The Biodiversity and Landscape subsidy scheme, the Vital Rural Area programme, the Gelders Warmte-Infrabedrijf, shared mobility, cycling stimulation and cooperation between 18 municipalities also show traction.
At the same time, the implementation gap remains large. Grid congestion, the pace of renovation, rising car traffic, slow electrification, agricultural emissions and limited industrial reduction keep the remaining task sharply in view.
Carbon as a visible second layer
The Snapshot & Reflection 2025 gives carbon sequestration a visible position next to emission reduction. The ambitious scenario contains 338 kton CO₂-eq sequestration potential per year. The largest components are CCS at waste-to-energy installations at around 231 kton, forest planting at around 100 kton and regenerative agriculture at around 6.5 kton.
Geological CCS in Gelderland is not possible due to the absence of suitable deep formations. Technological routes mainly consist of CCU and CCS at existing installations. AVR Duiven captures around 60 kton CO₂ per year for greenhouse horticulture as growth gas. ARN Weurt captures biogenic CO₂ from digestion. Scaling at Duiven can move towards an additional 150 kton per year, and the Duiven waste-to-energy facility can move towards around 300 kton per year in storage.
Natural sequestration is mainly located in agriculture and land use: humus formation, forest planting, agroforestry, peat meadow restoration and regenerative agriculture. Biobased building materials can also temporarily store hundreds of kilotonnes in buildings.
Top 15 climate opportunities
The ranking below shows the reduction potential in the ambitious scenario for 2030, in kton CO₂-eq per year.
| # | Solution | Domain | Potential |
|---|---|---|---|
| 1 | Solar on roofs | Energy | 1,632 |
| 2 | Zero-emission vehicles | Mobility | 1,386 |
| 3 | Onshore wind | Energy | 1,385 |
| 4 | Solar on land | Energy | 1,069 |
| 5 | Energy efficiency | Industry | 950 |
| 6 | Nuclear energy | Energy | 614 |
| 7 | Zero-emission zones | Mobility | 608 |
| 8 | Residential heat networks | Built environment | 503 |
| 9 | Smarter transport | Mobility | 500 |
| 10 | Heat pumps in utility buildings | Built environment | 489 |
| 11 | Residential insulation | Built environment | 285 |
| 12 | Landfill gas capture | Industry | 475 |
| 13 | Manure digestion and green gas | Agriculture | 327 |
| 14 | Plant-based diet | Agriculture | 319 |
| 15 | Feed transition | Agriculture | 305 |
Sector deep dives
Each sector has its own 2025 deep-dive page with the full progress analysis, solution tables, focus points and sector-specific insights.
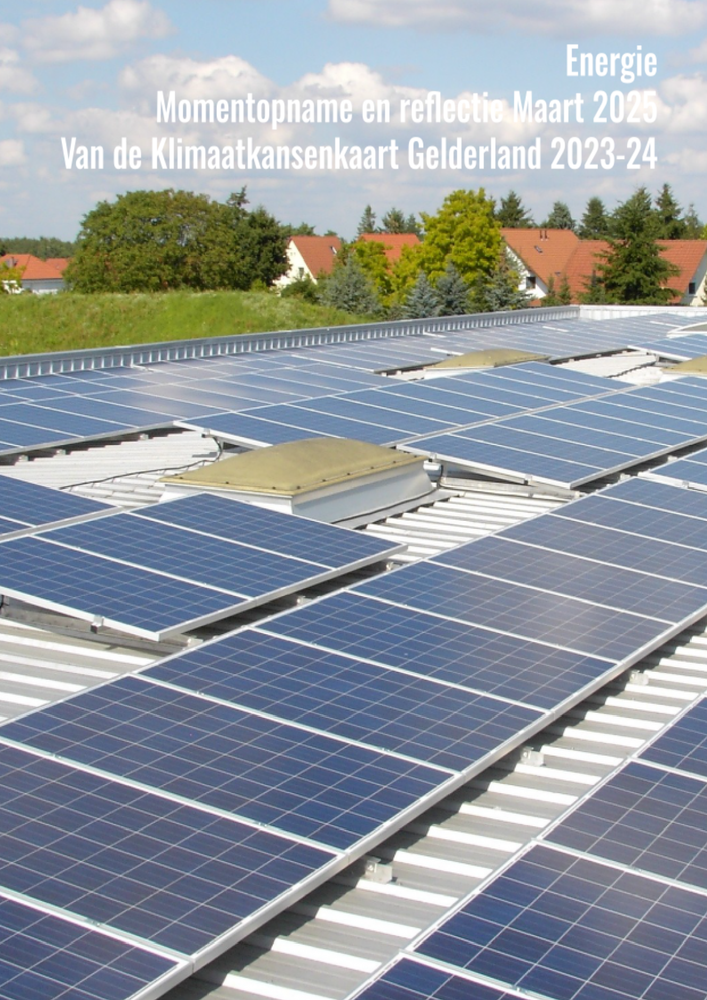
Energy
Emissions fall from 2.94 to 2.03 Mton. Around 31% of the potential has been realised.
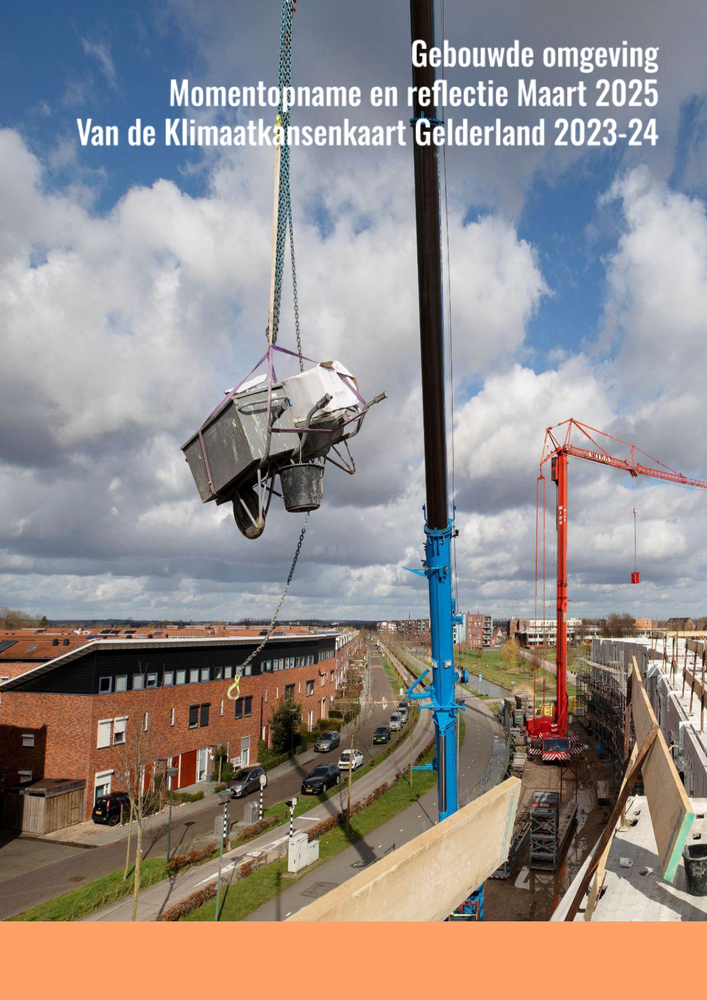
Built environment
Insulation and heat pumps drive a decline, but 77% of the potential remains open.
Agriculture and land use
Emissions are still rising. Natural carbon sequestration is the main additional opportunity.
Mobility
Mobility is the only rising sector. The 2030 potential is practically still fully open.
Industry
Industry lags behind the national picture. CCU, CCS, residual heat and energy efficiency are core routes.
Focus towards 2030 and 2050
The progress measurement points to seven logical next directions: accelerate implementation in energy and the built environment, structurally reverse mobility emissions, reduce agricultural emissions, scale natural carbon sequestration, apply technological sequestration selectively, include grid congestion and labour market constraints, and keep connecting monitoring to annual reflection.
The core task is implementation speed. The model is stable. The question shifts from what is possible to what is demonstrably being realised.
Insights from the analysis
Citable insights from the 2025 snapshot: key figures, observations and recommendations. Free to use under CC BY 4.0 with source attribution.
Frequently asked questions
What is the Snapshot & Reflection 2025 for Gelderland?
It is a progress layer on top of the Climate Opportunities Map Gelderland 2023-2024. The page shows what has been realised, where traction is visible and where the gap towards 2030 remains.
Does the 2025 snapshot replace the 2024 Climate Opportunities Map?
No. The 2024 map remains the planning and potential layer with 30 SMART solutions. The 2025 snapshot adds implementation status and reflection.
Why are TTW and WTW both used?
TTW is used for registered emissions within the provincial boundary. WTW is used to assess solution potential across the wider chain, from source to use.
What is the main conclusion?
The model is stable and the remaining task is primarily about implementation speed. Energy and the built environment are moving, while mobility, agriculture and industry require stronger acceleration.
How is carbon sequestration included?
Carbon sequestration is treated as a visible second layer next to emission reduction. The ambitious scenario includes 338 kton CO₂-eq sequestration potential per year.
Further reading
A climate action plan for a region?
From potential analysis to a concrete, quantified action plan for a province, municipality, value chain or company.