
Energy in the Gelderland 2025 snapshot
The Energy domain shows a strong decrease in emissions between 2021 and 2023. Emissions fell from 2,943.8 to 2,026.0 kton CO2-eq, a reduction of more than 31%. This sector page places that progress next to the remaining reduction potential towards 2030.
Strong decline, large remaining task
The 2025 publication is the progress layer on top of the Gelderland Climate Opportunities Map 2023-2024. The potential model remains largely unchanged; the added value lies in tracking realisation, reflection and the remaining gap.
For Energy, approximately 31.2% of the identified reduction potential has been realised. The main acceleration towards 2030 lies in rooftop solar, onshore wind, ground-mounted solar, flexibility, storage and resolving grid congestion.
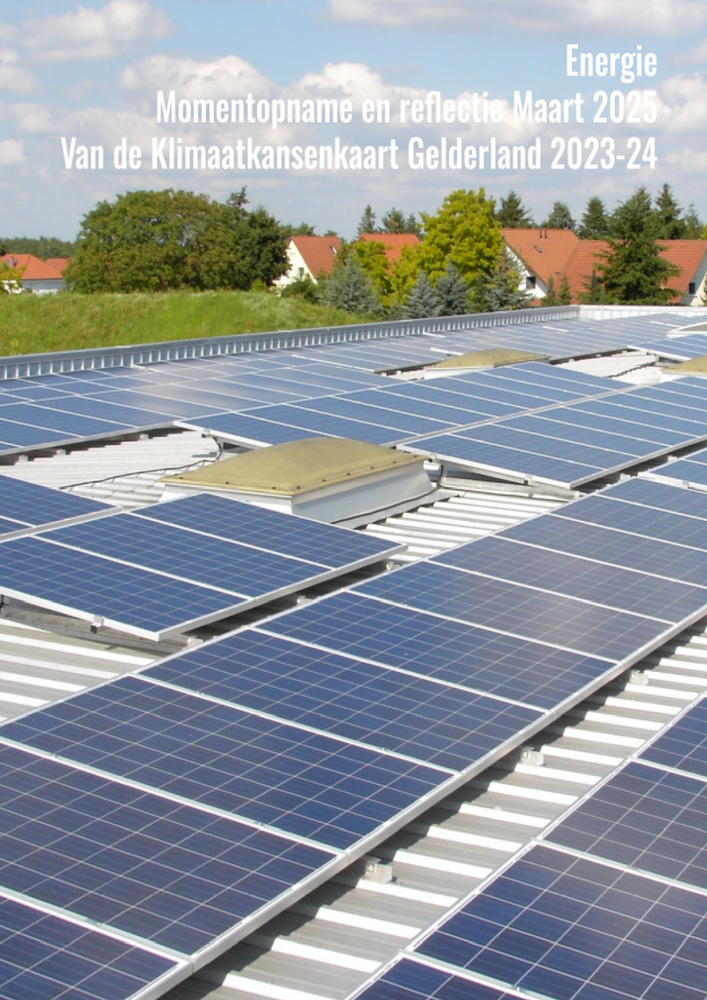
Reading guide
Published in March 2025. The analysis is based on emissions data through 2022 and 2023. Registration data lags a few years behind publication, which means that each edition uses the most recent fully available data years. This snapshot reflects on the Gelderland Climate Opportunities Map 2023-2024, which was based on data through 2021.
TTW and WTW
Emission reporting follows TTW: direct emissions within the provincial boundary. Reduction potential follows WTW: full chain emissions from source to use. WTW is generally about 5 to 10% higher than TTW. For Gelderland, the difference is approximately 9% in the Reference scenario and approximately 5% in the Ambitious scenario.
Energy as a system lever
Energy in this analysis covers large-scale generation and energy infrastructure. Decarbonising the energy mix not only lowers emissions in the energy domain itself, it also enables electrification in mobility, industry and the built environment.
What is progressing
Solar and wind energy are visibly contributing to lower emissions. Smart Energy Hubs and cable pooling are being tested in Rivierenland, Arnhem-Nijmegen and the Achterhoek.
What is lagging
Grid congestion slows down new renewable generation and electrification in other domains. Storage, hydrogen and peak-load management are not yet scalable enough.
Seven energy solutions
Together, the seven energy solutions represent 3,267 kton CO2-eq of avoided emissions potential in the Reference scenario and 5,143 kton CO2-eq in the Ambitious scenario.
| Solution | Reference 2030 | Ambitious 2030 | Application |
|---|---|---|---|
| Rooftop solar | 1,306 kton | 1,632 kton | Roofs of business parks, public buildings and other suitable roof surfaces. |
| Onshore wind | 885 kton | 1,385 kton | RES locations, spatial trade-offs and public acceptance. |
| Ground-mounted solar | 855 kton | 1,069 kton | Solar parks combined with spatial quality, nature or water. |
| Nuclear energy | 0 kton | 614 kton | Possible long-term component, not feasible before 2030. |
| Deep geothermal energy | 75 kton | 151 kton | Heat extraction, heat networks and seasonal storage. |
| Aquathermal energy | 75 kton | 150 kton | Heat from water linked to area-based heating systems. |
| Spreading energy consumption | 71 kton | 143 kton | Demand response, flexibility contracts, storage and peak-load management. |
Downloads and related pages
FAQ Energy snapshot
How much did Energy emissions fall?
Energy emissions in Gelderland fell by more than 31% between 2021 and 2023.
What is the largest energy solution?
Rooftop solar is the largest single energy solution in the Ambitious scenario, with 1,632 kton CO2-eq potential per year in 2030.
Why does grid congestion matter?
Grid congestion delays new renewable generation, electrification and flexibility solutions across multiple domains.
Insights from this project
Frequently asked questions about energy in Gelderland
According to this snapshot, the seven core energy solutions add up to 3,267 kton CO₂-eq in the Reference scenario and 5,143 kton CO₂-eq in the Ambitious scenario.
According to this snapshot, Gelderland added roughly 60.69 MWp of additional rooftop solar in 2023, or about 30.35 hectares of roof surface.
According to this snapshot, the number of wind turbines grew from 61 in 2021 to 81 in 2023; onshore wind has a reduction potential of 885 kton (Reference) to 1,385 kton (Ambitious) in 2030.
According to this snapshot, nuclear energy is not feasible before 2030 and stands at 0 kton in the Reference scenario; only in the Ambitious scenario does it count, with 614 kton CO₂-eq, as a possible long-term baseload.
According to this snapshot, decarbonising the energy mix not only lowers its own emissions but also enables electrification in mobility, industry and the built environment.
According to this snapshot, Smart Energy Hubs and cable pooling are being tested in Rivierenland, Arnhem-Nijmegen and the Achterhoek to relieve grid congestion.
According to this snapshot, deep geothermal energy provides 75 to 151 kton and aquathermal energy 75 to 150 kton CO₂-eq of reduction potential in 2030, linked to heat networks and seasonal storage.
According to this snapshot, the Gelderland Energy Infrastructure Programme, pMIEK 2.0 and the renewed Climate Programme are relevant for accelerating generation, grid capacity and demand management.
From potential to implementation
Energy remains the enabling domain for the wider Gelderland transition towards 2030.