
Scope 1, 2 and 3 mapped for CSRD
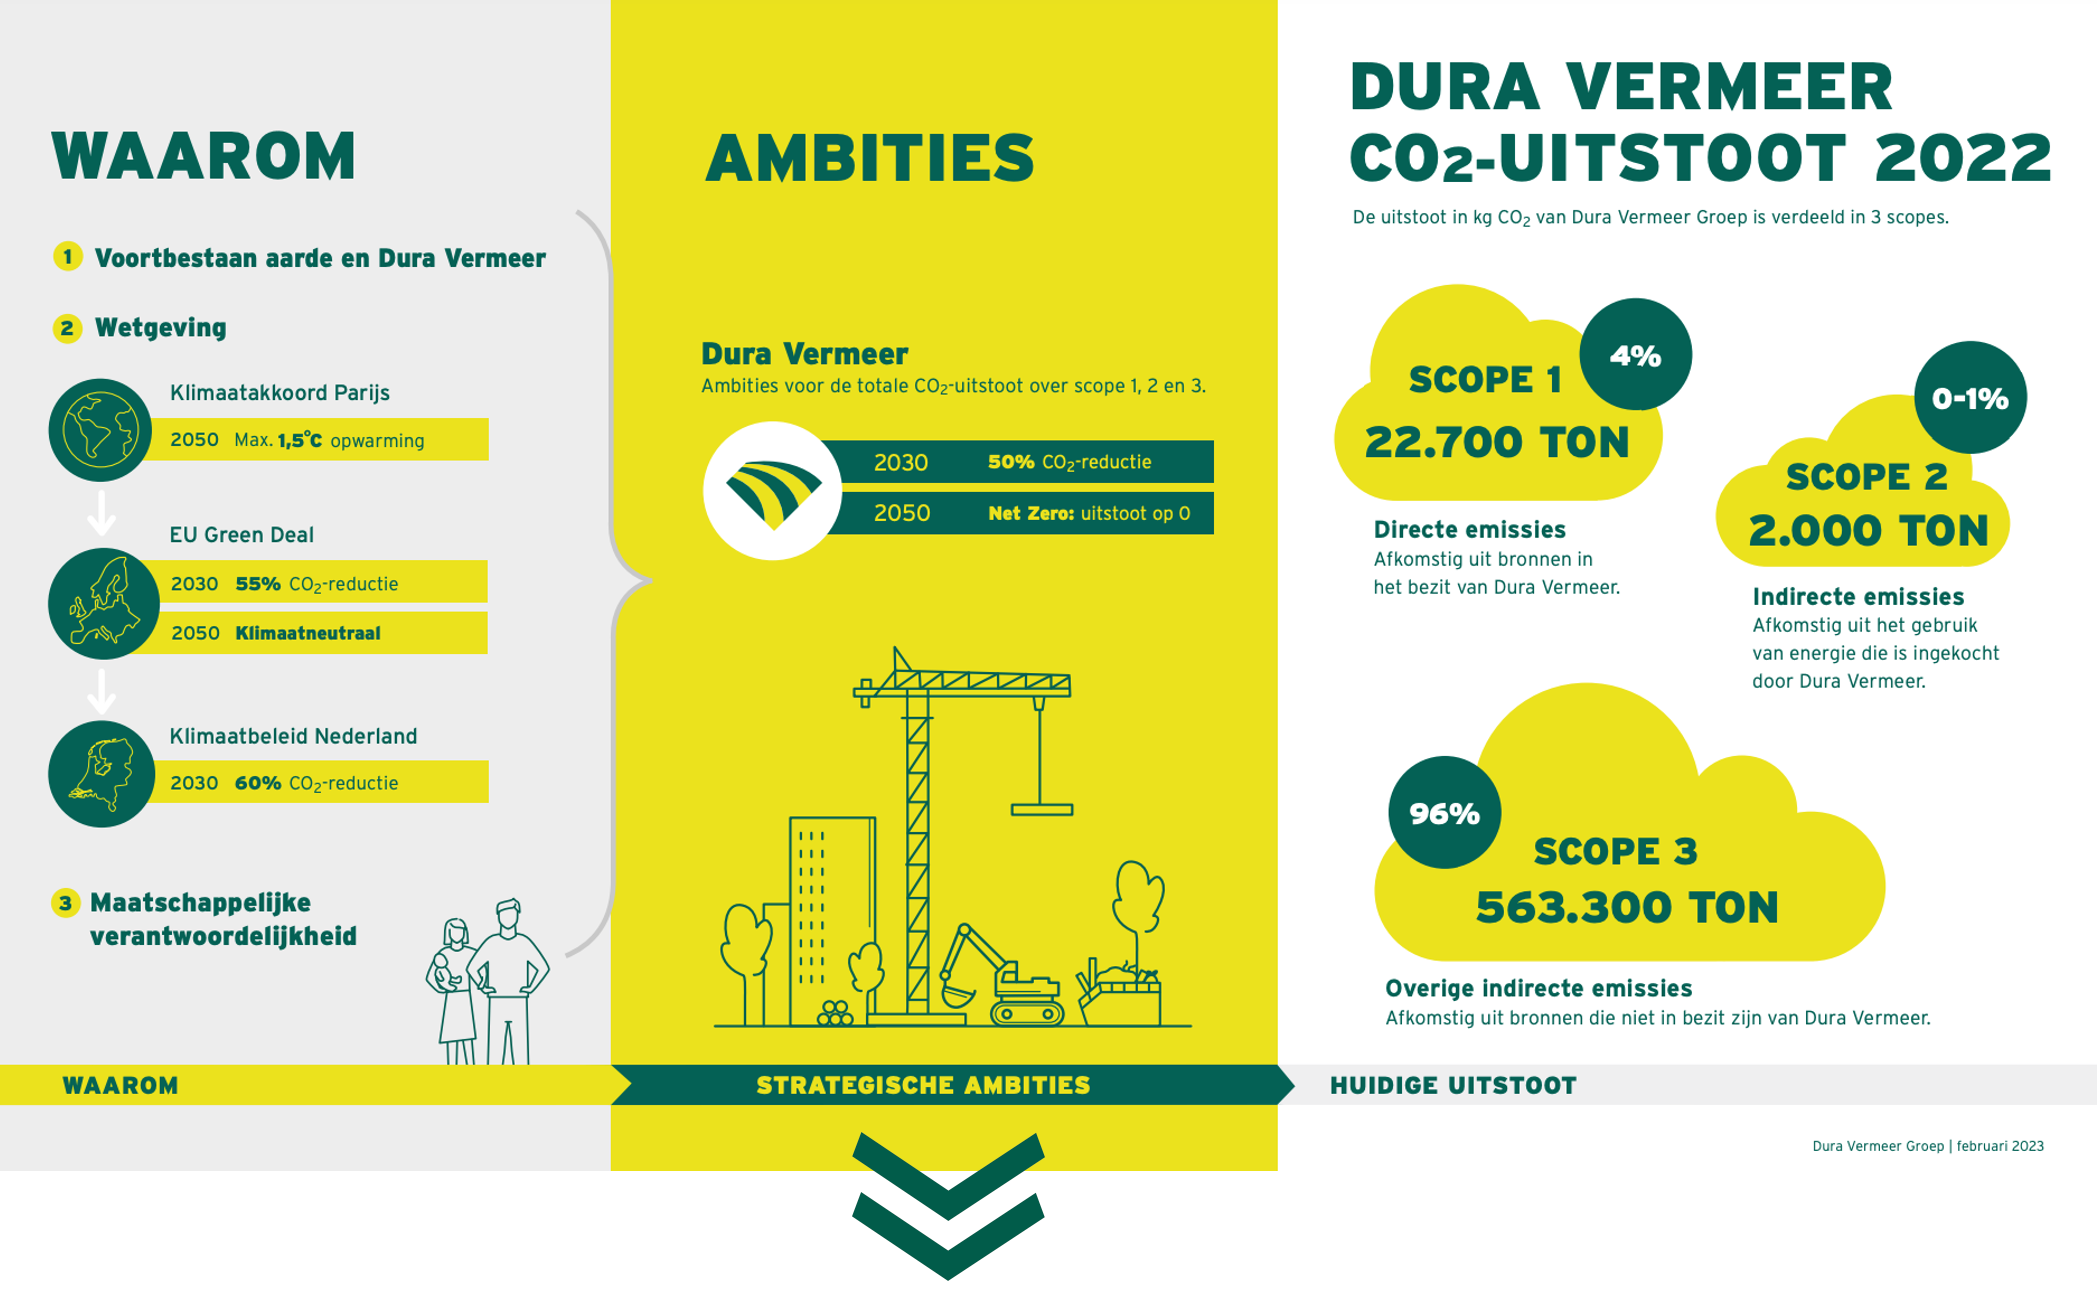
New Economy and 2Impact mapped the full CO₂ footprint of construction and infrastructure group Dura Vermeer as a basis for CSRD reporting. The outcome: 96% of emissions sit in scope 3, totalling 563,300 tonnes of CO₂. A methodology and handbook make annual repetition possible.
About this project
- Prepared by
- New Economy (climate component) together with 2Impact.
- Client and sector
- Dura Vermeer — construction and infrastructure.
- The question
- How to map the full CO₂ footprint (scope 1, 2 and 3) of the holding company for CSRD, harmonised across the subsidiaries.
- The result
- 96% of emissions in scope 3 (563,300 tonnes of CO₂), plus a methodology and handbook for annual repetition.
In short
For construction and infrastructure group Dura Vermeer, New Economy and 2Impact mapped the full CO₂ footprint — scope 1, 2 and 3 — as a basis for CSRD reporting. For a group with thousands of suppliers and subcontractors, from window frames for buildings to crash barriers for the Dutch railway network, that is a substantial task.
Most of it sits in the chain. 96% of emissions fall within scope 3 — at suppliers, in materials and in the use of products. That is where the biggest reduction levers lie, not in the company’s own operations.
The question
Dura Vermeer wanted to map the climate impact of the entire holding company — scope 1, 2 and 3 — and harmonise that impact across its various subsidiaries, in view of upcoming CSRD reporting.
The approach
New Economy and 2Impact prepared this family business for CSRD compliance together; New Economy handled the climate component. Together they developed methodologies and calculation rules to independently calculate CO₂ impact, in line with CSRD guidelines and based on the GHG Protocol.
The method: four steps to scope 3
Mapping scope 3 followed four steps.
A handbook for annual repetition. New Economy and 2Impact recorded the measurement and reporting methodology for the CO₂ footprint across scope 1, 2 and 3 in a handbook, built on the GHG Protocol and aligned with the CO₂ Performance Ladder and the CSRD. The data follows the order measure, calculate, estimate, with independent verification.
The result
The key figures are shown as cards above. The vast majority of emissions turn out to sit in the chain. The breakdown by source:
| Source | Share |
|---|---|
| Scope 3 (chain, outside own ownership) | 96% — 563,300 tonnes of CO₂ |
| Purchase of raw materials and materials (asphalt, concrete, steel, wood, infrastructure) | 62% |
| Use of products sold (such as homes built) | 30% |
| Scope 1 and 2 (own operations) | 4% |
The methodology has been recorded in a handbook, so Dura Vermeer can repeat the footprint independently every year.
What this delivers
Insight into the footprint is the first step. It shows where the biggest levers lie — for Dura Vermeer mainly in chain emissions — and forms the basis for reduction, CSRD reporting and a shift towards regenerative construction. It usually starts with a baseline measurement.
Insights from this project
Frequently asked questions
They mapped the full CO₂ footprint (scope 1, 2 and 3) and developed a methodology and handbook for CSRD reporting; New Economy handled the climate component.
96% — the chain emissions that Dura Vermeer does not own itself, totalling 563,300 tonnes of CO₂.
62% from purchased raw materials and materials, and 30% from the use of products sold, such as homes built.
According to the GHG Protocol, in four steps: define scope, collect data, determine impact and validate.
The construction and infrastructure sector.
Frequently asked questions about scope 1, 2 and 3
Scope 1 and 2 are the direct and energy-related emissions of a company’s own operations; scope 3 is the indirect emissions in the chain. In this project, own operations (scope 1 and 2) accounted for just 4% of the total.
The CSRD calls for substantiated, comparable climate data across the whole holding. In this project the footprint across scope 1, 2 and 3 was harmonised across the subsidiaries as a basis for it.
The GHG Protocol is the international standard for calculating greenhouse-gas emissions. In this project it formed the basis for the measurement and calculation rules, aligned with the CO₂ Performance Ladder and the CSRD.
Emission sources are preferably measured directly; if not, calculated based on fuels, materials and services; and only estimated as a last resort. This keeps the data as reliable as possible, with independent verification.
The handbook records the measurement and reporting methodology, so Dura Vermeer can repeat the footprint across scope 1, 2 and 3 independently every year.
The total footprint of 563,300 tonnes of CO₂ equals almost 1% of direct Dutch emissions.
New Economy handled the climate component; together with 2Impact, Dura Vermeer was prepared for CSRD compliance, with jointly developed methodologies and calculation rules.
Insight into the footprint shows where the levers lie and forms the basis for reduction, CSRD reporting and a shift towards regenerative construction. It usually starts with a baseline measurement.
Related reading
Footprint mapped for CSRD
From scope 1, 2 and 3 to a substantiated footprint and a methodology to repeat it independently every year. See also Baseline measurement / footprint.
Plan a conversation