
Gelderland Climate Opportunities Map 2025
The Gelderland Climate Opportunities Map 2025 makes the shift from potential to progress visible. The 2024 map layer remains the planning and potential layer. The 2025 map layer shows which reduction has been realised, which domains are accelerating and where the remaining gap towards 2030 lies.
The core of this page is the year comparison. The existing 2024 map remains available as the base layer for potential, scenarios and 30 SMART climate solutions. The new 2025 layer adds realisation, reflection and implementation pace.
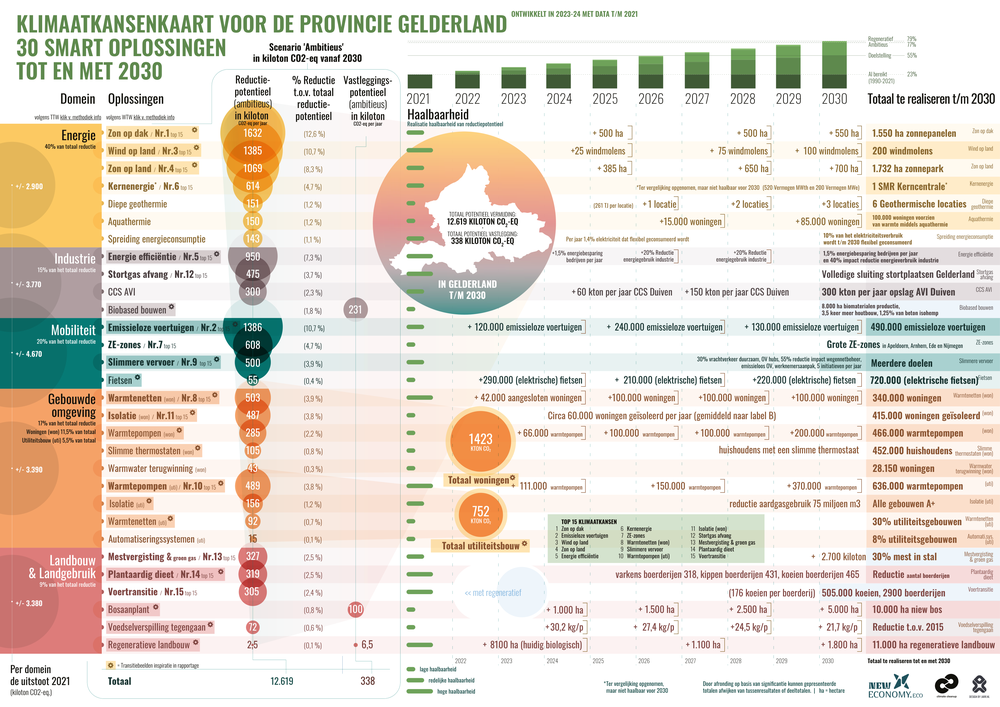
2024 as the potential map
The 2024 map layer shows which 30 SMART climate solutions are possible towards 2030. The basis lies in scenarios, reduction potential and sequestration potential. This layer remains necessary to understand the implementation pathway.
Colour represents potential towards 2030.
Scenarios, reduction potential, sequestration potential and prioritisation per solution.
2025 as the progress picture
The 2025 map layer shows how much of the potential has been used. Energy and the built environment are clearly declining. Mobility is still rising. Agriculture and industry remain critical domains for acceleration.
Colour represents realisation or the remaining gap.
The slider moves from calculated potential to measured progress. This creates a family of maps: 2024 shows what is possible, 2025 shows what is happening.
Difference between potential and realisation
The difference mode is the logical next interactive step. This layer shows, per domain, which part of the 2030 potential is already visible in the emission registration and which part is still open.
| Domain | Signal 2025 | Interpretation |
|---|---|---|
| Energy | approximately 31% realised | Clear movement; the remaining task stays large due to growing electricity demand and grid congestion. |
| Built environment | approximately 23% realised | Insulation, heat pumps and heat networks are getting underway; pace remains decisive. |
| Mobility | approximately 0% realised | The sharpest warning sector, because emissions are still rising. |
| Industry | the majority remains | Energy efficiency, CCU, residual heat and landfill gas capture are the main levers. |
| Agriculture and land use | the majority remains | Large natural sequestration potential, while emissions are still rising. |
Publication, data range and interpretation
- Publication
- March 2025.
- Data basis
- The analysis is based on emission data up to and including 2022 and 2023. Registration data lags the publication moment by several years.
- Relation to 2024
- The Gelderland Climate Opportunities Map 2023-2024 is based on data up to and including 2021 and forms the planning and potential layer.
- Interpretation
- 2025 does not replace 2024. The value lies in the comparison between potential, implementation pace and the remaining gap.
Dashboard 2025
Gelderland has achieved approximately 28% emission reduction relative to 1990. The target for 2030 is 55%. The fully ambitious scenario arrives at approximately 77% reduction. The regenerative scenario arrives at approximately 79% reduction.
| Measurement point | Value | Meaning |
|---|---|---|
| Reduction achieved | 28% | Reduction relative to 1990, based on the available registration years. |
| Target 2030 | 55% | Target direction for 2030. |
| Fully ambitious scenario | 77% | Indication of the range if the calculated solutions are implemented ambitiously. |
| Regenerative scenario | 79% | Indication of the range with additional regenerative solution directions. |
| Sequestration potential | 338 kton CO₂-eq per year | Combination of natural and technological carbon sequestration. |
Progress per domain
Progress is unevenly distributed. The 2025 map layer makes those differences visible and helps to aim the implementation agenda more precisely.
| Domain | Emission development | Realisation of potential | Main reduction solution |
|---|---|---|---|
| Energy | approximately 31% decline, from 2.94 to 2.03 Mton | approximately 31% realised | Rooftop solar, 1,632 kton |
| Built environment | approximately 23% decline | approximately 23% realised | Residential heat networks, 503 kton |
| Industry | approximately 4.3% decline between 2021 and 2022 | the majority remains | Energy efficiency, 950 kton |
| Mobility | rising sector | approximately 0% realised | Zero-emission vehicles, 1,386 kton |
| Agriculture and land use | approximately 5% increase between 2021 and 2022 | the majority remains | Manure digestion and green gas, 327 kton |
Top 15 climate opportunities towards 2030
The largest climate opportunities remain highly comparable in size to the earlier map. What distinguishes 2025 is above all the realisation analysis: what is already in motion, and where does the implementation pace need to rise?
| # | Solution | Domain | Reduction potential, ambitious 2030 |
|---|---|---|---|
| 1 | Rooftop solar | Energy | 1,632 kton |
| 2 | Zero-emission vehicles | Mobility | 1,386 kton |
| 3 | Onshore wind | Energy | 1,385 kton |
| 4 | Ground-mounted solar | Energy | 1,069 kton |
| 5 | Energy efficiency | Industry | 950 kton |
| 6 | Nuclear energy | Energy | 614 kton |
| 7 | Zero-emission zones | Mobility | 608 kton |
| 8 | Residential heat networks | Built environment | 503 kton |
| 9 | Smarter transport | Mobility | 500 kton |
| 10 | Heat pumps in non-residential buildings | Built environment | 489 kton |
| 11 | Home insulation | Built environment | 285 kton |
| 12 | Landfill gas capture | Industry | 475 kton |
| 13 | Manure digestion and green gas | Agriculture | 327 kton |
| 14 | Plant-based diet | Agriculture | 319 kton |
| 15 | Feed transition | Agriculture | 305 kton |
Method TTW and WTW
Emission registration uses a TTW approach: direct emissions within the provincial boundaries. Reduction potential uses a WTW approach: the full chain emissions of a solution. As a result, the calculated solution potential can be higher than the direct emission registration.
In Gelderland, WTW is approximately 9% higher than TTW in the estimate and approximately 5% higher than TTW in the ambitious scenario. Double counting is avoided by counting only realised measures as a solution.
Downloads and map layers
PDFGelderland Climate Opportunities Map 2025AI-light map file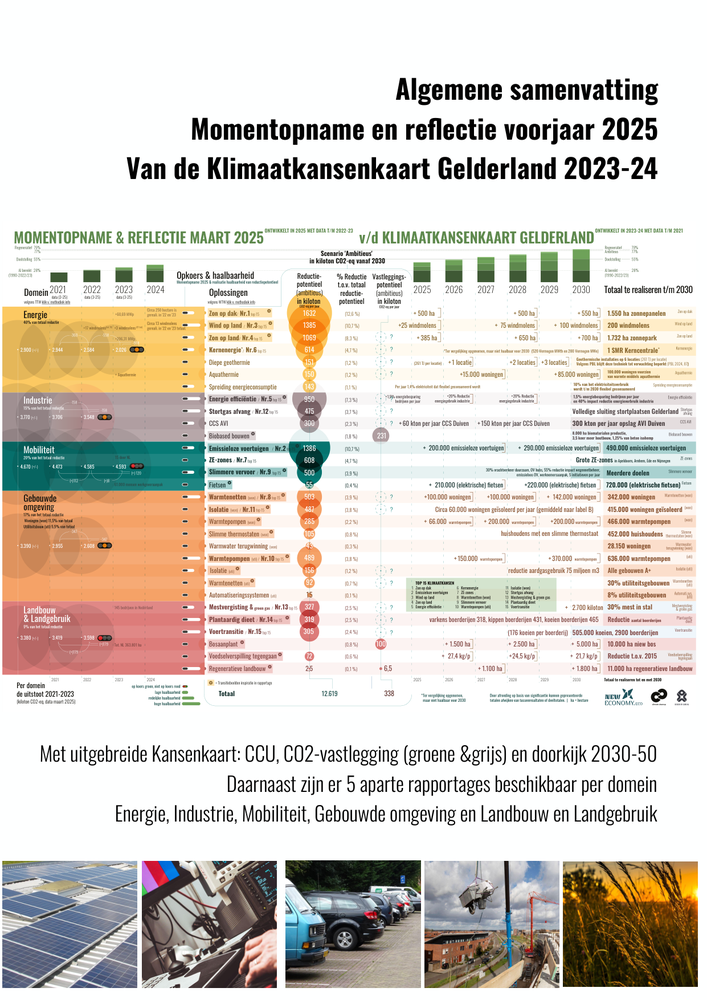 PDFSummary of the 2025 SnapshotOverarching analysisPDFMethodological substantiationPotential per solutionPDFMap layer 2024Potential map as archive and comparison layer
The report files are published in Dutch.
Project family Gelderland
Together, the Gelderland publications form four layers: the first exploration, the potential map, the progress layer and the deep dive into carbon sequestration. The 2025 map layer belongs alongside the existing 2024 map.