
Mobility in the Gelderland climate snapshot
Mobility is the sharpest warning sector in the Gelderland Snapshot & Reflection 2025. Emissions increased from 4,473.3 to 4,593.3 kton CO2-eq between 2021 and 2023, while approximately 0% of the identified reduction potential has been realised.
The largest remaining implementation gap
The mobility transition is not yet visible in the emissions data. The sector still moves in the wrong direction, while the 2030 potential remains almost fully open.
The key solutions are emission-free vehicles, zero-emission zones, smarter mobility and cycling. Electrification is important, but not sufficient without fewer fossil kilometres, logistics bundling and modal shift.
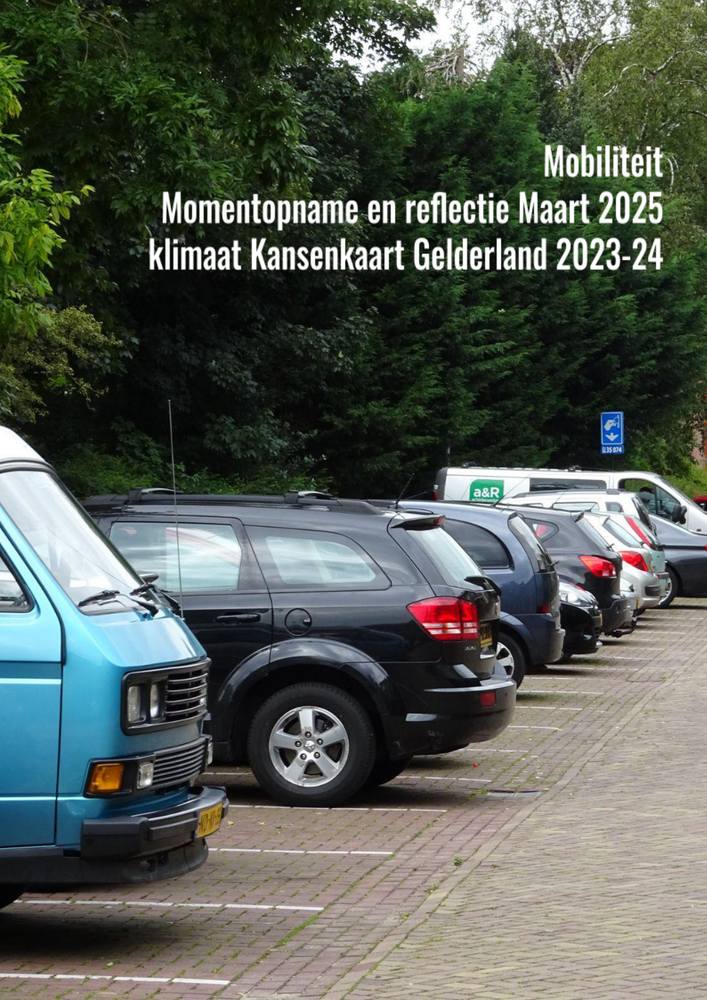
Reading guide
Published in March 2025. The analysis is based on emissions data through 2022 and 2023. Registration data lags a few years behind publication, which means that each edition uses the most recent fully available data years.
TTW and WTW
Emission reporting follows TTW: direct emissions within the provincial boundary. Reduction potential follows WTW: full chain emissions from source to use. This distinction is especially relevant for electric vehicles, where direct emissions fall to zero but upstream electricity emissions remain part of the chain impact.
Mobility profile
Mobility in Gelderland is still dominated by road traffic and fossil kilometres. The sector requires a combined approach: cleaner vehicles, zero-emission logistics, fewer unnecessary trips, more shared mobility and stronger active mobility.
What is progressing
Zero-emission zones, charging infrastructure, cycling policy and employer mobility measures provide starting points for change.
What is lagging
Total mobility emissions are still rising, and the identified reduction potential has not yet translated into measured sector-wide emission decline.
Four mobility solutions
Together, the mobility solutions represent 536 kton CO2-eq of potential in the Reference scenario and 2,549 kton CO2-eq in the Ambitious scenario.
| Solution | Reference 2030 | Ambitious 2030 | Application |
|---|---|---|---|
| Emission-free vehicles | 253 kton | 1,386 kton | Electric cars, vans, freight vehicles and charging infrastructure. |
| Zero-emission zones | 152 kton | 608 kton | Urban logistics, municipal zones and cleaner delivery systems. |
| Smarter mobility | 100 kton | 500 kton | Shared mobility, logistics bundling, public transport and avoided trips. |
| Cycling | 31 kton | 55 kton | Mode shift to bicycle and e-bike for shorter trips. |
Downloads and related pages
FAQ Mobility snapshot
Why is Mobility a warning sector?
Because emissions increased between 2021 and 2023, while the identified 2030 reduction potential is still almost fully open.
Is electrification enough?
No. Electrification is essential, but must be combined with zero-emission zones, smarter mobility, logistics bundling and cycling.
What is the largest mobility solution?
Emission-free vehicles have the largest potential in the Ambitious scenario, with 1,386 kton CO2-eq per year in 2030.
Insights from this project
Frequently asked questions about mobility in Gelderland
According to this snapshot, mobility emissions are still rising, by roughly 120 kton (2.7%) between 2021 and 2023, while domains such as energy and the built environment are already falling; as a result almost the entire 2030 potential is still open.
According to this snapshot, the four solutions add up to 536 kton CO₂-eq in the Reference scenario and 2,549 kton CO₂-eq in the Ambitious scenario for 2030.
According to this snapshot, urban hubs such as Arnhem, Nijmegen, Ede and Apeldoorn are relevant for zero-emission zones, with a reduction potential of 152 to 608 kton CO₂-eq.
No. According to this snapshot, electrification is the biggest lever, but zero-emission zones, smarter mobility and cycling are also needed to bring down fossil kilometres, logistics movements and car trips.
According to this snapshot, after 2030 the task shifts from technical replacement to system change: emission-free vehicles, shared mobility, strong cycling and public-transport networks, compact spatial development and logistics with fewer trips.
According to this snapshot, smarter mobility, through shared mobility, mobility hubs, MaaS and logistics bundling, has a reduction potential of 100 kton in the Reference scenario to 500 kton in the Ambitious scenario in 2030.
According to this snapshot, mobility covers passenger traffic, van traffic, freight traffic and mobile machinery; most emissions come from road traffic and its exhaust emissions.
According to this snapshot, practically the entire 2030 reduction potential is still available, because realised measures are not yet visible in a declining emissions registration.
Mobility must turn from growth to reduction
The 2030 task is mainly an implementation challenge: the potential is known, but the measured transition is not yet visible.