Interactive Climate Opportunities Map Gelderland
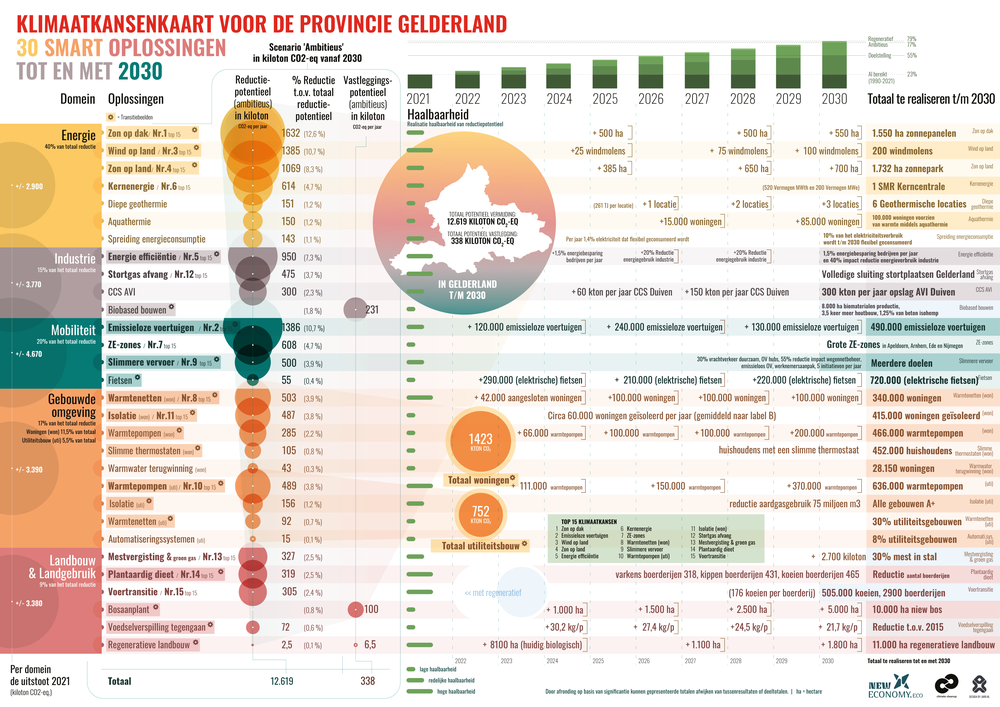
The Climate Opportunities Map Gelderland sets out 30 SMART climate solutions up to 2030, across five domains: energy, built environment, agriculture and land use, mobility and industry. Together these solutions offer a reduction potential of 12,619 kton CO₂-eq, more than one and a half times the provincial task of 7,500 kton (55% relative to 1990). Part of the Gelderland Climate Opportunities Map.
Concepts on this page
30
SMART solutions across five domains
12,619
kton CO₂-eq reduction potential (2030)
18.1
Mton emissions Gelderland (2021)
7,500
kton task for 2030 (55% relative to 1990)
How the map works
Explore the solutions
The interactive map sets all 30 solutions side by side. Choose a target horizon (2025, 2028 or 2030), switch between the ambitious and the regenerative scenario, and filter by domain. Ticking solutions on or off immediately shows how much CO₂ is avoided or sequestered, and whether the task of 7,500 kton is met.
The map file is published in Dutch.