Built environment in the Gelderland 2025 climate snapshot
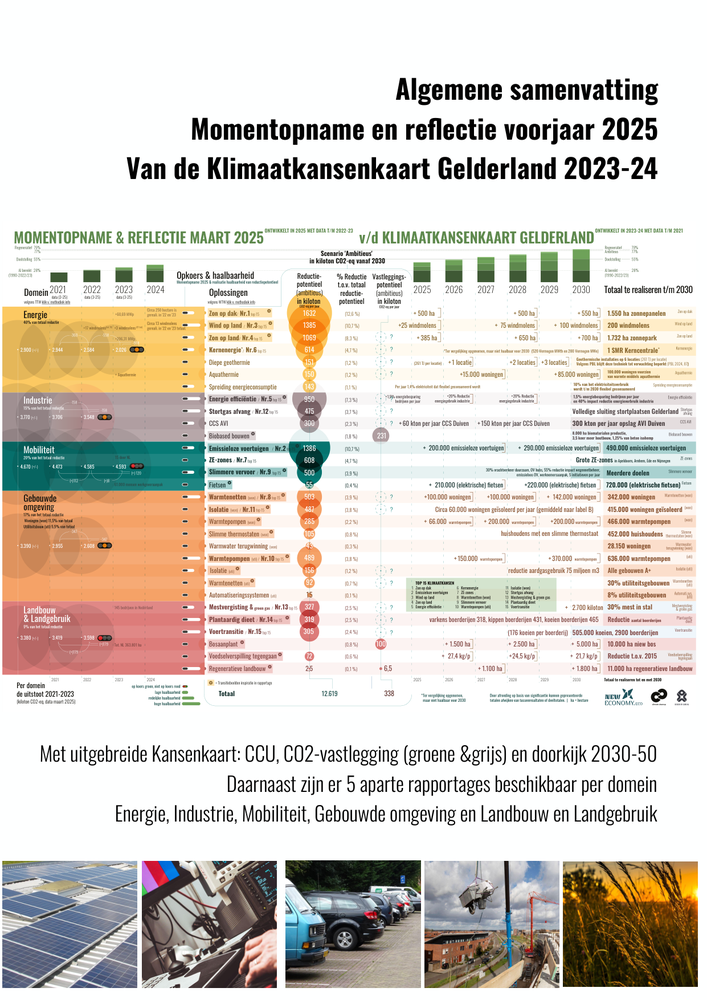
The built environment in Gelderland shows an emissions reduction of approximately 23% between 2021 and 2023. At the same time, around 23% of the 2030 potential has been realised, leaving roughly 77% still open. The largest remaining levers are residential heat networks, heat pumps in non-residential buildings and home insulation.
Progress in homes and non-residential buildings
This page adds a progress layer to the earlier Climate Opportunities Map Gelderland 2023-2024. The 2024 page remains the planning and potential layer. This 2025 snapshot shows how much traction is now visible and where acceleration is still required.
Data and position in the project family
Publication: March 2025. The analysis is based on emissions data through 2022 and 2023. Registration data lags behind the publication date by several years, so each edition uses the most recent fully available data years. This snapshot reflects on the Climate Opportunities Map Gelderland 2023-2024, which is based on data through 2021.
The 2025 publication does not replace the earlier Climate Opportunities Map. The earlier map remains the planning and potential layer with 30 SMART solutions. The Snapshot & Reflection 2025 adds a progress layer: realisation, traction, the remaining implementation gap and key points of attention towards 2030.
TTW for emissions, WTW for reduction potential
- Emissions
- Direct emissions within provincial boundaries, using TTW: Tank-to-Wheel. Main source: emissieregistratie.nl.
- Reduction potential
- Full value-chain emissions, using WTW: Well-to-Wheel. This includes emissions from source to use.
- Difference
- WTW is approximately 5 to 10% higher than TTW. For Gelderland, this is approximately 9% in the baseline scenario and approximately 5% in the ambitious scenario.
- Double counting
- Double counting is avoided. Only implemented measures count as realised solutions.
- Further detail
- TTW versus WTW methodology page.
Emissions are falling, but implementation speed remains decisive
Emissions from the built environment in Gelderland fell by approximately 23% between 2021 and 2023. This decrease is slightly above the national average and is linked to insulation, heat pumps and lower natural gas use in homes and non-residential buildings.
The reduction is substantial, but it does not yet prove that the sector is automatically on track for 2030. The remaining task lies mainly in the speed at which existing homes and non-residential buildings are insulated, supplied with fossil-free heat and connected to appropriate heat technologies.
Progress snapshot. The 2025 publication looks not only at potential, but also at realised emissions reduction and the remaining implementation gap.
Around 23% realised, 77% still open
Within the built environment, around 23% of the 2030 potential has been realised. This leaves approximately 77% of the potential still open. The sector is therefore both a progress sector and an acceleration sector.
Realised
The emissions decline shows that the first layer of insulation, heat pumps and more efficient heat use is now visible in the figures.
Remaining potential
Most of the task still requires implementation: renovation speed, financing, installer capacity and area-based heat infrastructure.
The core question towards 2030 is therefore not whether the solutions are known. The core question is whether the renovation wave, heat pump rollout and heat network development can be organised fast enough.
Largest solutions in this sector
The three largest remaining levers in the built environment are residential heat networks, heat pumps in non-residential buildings and home insulation. Together, these measures form the core of the area-based heat and renovation task.
| Solution | Ambitious 2030 potential | Role in implementation |
|---|---|---|
| Residential heat networks | 503 kt CO₂-eq/year | Largest single lever. Most relevant in dense areas with suitable sources such as geothermal energy, aquathermal energy or residual heat. |
| Heat pumps in non-residential buildings | 489 kt CO₂-eq/year | Electrification of heating and cooling in offices, healthcare buildings, schools, shops and other non-residential buildings. |
| Home insulation | 285 kt CO₂-eq/year | Basic measure for lower heat demand, lower energy bills and suitability for low-temperature heating. |
In addition to this top three, heat pumps in homes, insulation of non-residential buildings, heat networks for non-residential buildings, smart thermostats, heat recovery from domestic hot water and building management systems remain relevant. The sector analysis provides the full substantiation per solution.
What is working and what is lagging behind
What is working
The emissions decline is visible. Insulation, heat pumps and more efficient energy use are producing measurable progress. The built environment is therefore performing better than sectors where emissions are still rising or barely falling.
What is lagging behind
The renovation pace remains too low. Financing barriers, information barriers, limited implementation capacity and scarcity of biobased materials are slowing down scaling.
The built environment therefore requires a combination of individual measures and collective area-based approaches. Stand-alone home measures are not sufficient when neighbourhood heat, grid capacity, financing and implementation capacity are not organised in parallel.
Focus towards 2030
The focus towards 2030 is a large-scale insulation and renovation wave, rapid scaling of heat pumps and area-based heat networks. Low-threshold measures remain important: smart thermostats, draught sealing, hydronic balancing, domestic hot water heat recovery and building management systems can quickly contribute to lower heat demand.
The greatest acceleration emerges when measures are bundled by neighbourhood, real estate portfolio or building type. This makes collective procurement, standardised renovation packages, social prioritisation and connection with grid capacity easier to implement.
Outlook 2030-2050
After 2030, the task shifts from separate sustainability measures to structural redesign of heat supply, material use and building quality. Low-temperature heat, heat networks, heat pumps, seasonal storage and demand-side management then become stronger parts of one energy system.
The built environment therefore becomes not only an emissions reduction sector, but also a materials and storage sector. Renovation, biobased insulation and timber construction can connect lower energy demand with temporary to medium-term carbon storage in buildings.
Biobased construction as a carbon storage layer
Biobased building materials store CO₂ temporarily to medium term in buildings. Timber, flax, hemp and other fibre crops can lower heat demand, replace fossil-based materials and store carbon for as long as the material remains applied in the built environment.
For Gelderland, this is especially relevant in renovation, insulation and new construction. The built environment sector thereby connects the heat transition with the broader carbon storage agenda. More background is available in the Gelderland carbon exploration.
Method and sources
Emissions development is read through TTW: direct emissions within provincial boundaries. The reduction potential of solutions is calculated through WTW: full value-chain emissions from source to use. This separation makes historical emissions registration and solution potential comparable without double counting.
The figures are used to order opportunities and are not project-specific guarantees. Assumptions, system boundaries and references are fully documented in the sector analysis and methodological appendix.
Insights from this sector
Citable figures, observations and recommendations from the Snapshot & Reflection 2025. Free to use under CC BY 4.0, with source attribution.
| Insight | Why it matters |
|---|---|
| Approximately 23% of the 2030 potential has been realised. | The sector shows visible progress, but most of the implementation task still lies ahead. |
| Emissions fell by approximately 23% between 2021 and 2023. | The decline indicates measurable traction from insulation, heat pumps and lower gas use. |
| Residential heat networks represent 503 kt CO₂-eq/year in ambitious 2030 potential. | This makes them the largest single lever in the sector analysis. |
| Heat pumps in non-residential buildings represent 489 kt CO₂-eq/year. | Offices, schools, healthcare buildings and shops form a major electrification opportunity. |
| Biobased insulation links renovation with carbon storage. | The built environment can reduce heat demand and store carbon in materials at the same time. |
The built environment shows an emissions reduction of approximately 23% between 2021 and 2023. At the same time, around 23% of the 2030 potential has been realised, leaving roughly 77% still open.
Residential heat networks have the largest potential within the built environment in the ambitious scenario: 503 kt CO₂-eq per year towards 2030.
The main delays are renovation speed, financing and information barriers, implementation capacity and availability of biobased materials. Progress is visible, but not yet fast enough.
Emissions development follows TTW: direct emissions within provincial boundaries. The reduction potential of solutions follows WTW: full value-chain emissions from source to use. This prevents methodological confusion and double counting.
Biobased building materials can lower heat demand, replace fossil-based materials and store CO₂ temporarily to medium term in buildings. This links emissions reduction with carbon storage.
Further reading
From snapshot to implementation agenda
Regions, municipalities and value chains can move from opportunity mapping to progress measurement, prioritisation and a concrete implementation agenda.
View the approach